Monitoring and Analysis Tools Graphics Data Logger
OceanTRx
TM
4-500 Installation and Operations Manual 9-11
3. Set the desired sampling time and sampling points.
NOTE: When logging data at 1 sample per tick, it is recommended to set the number of points to
30,720, corresponding to 60 seconds of logging time per tick. Consequently, each additional minute
represents a single tick.
4. Click OK (Enter). The Logger Configuration dialog box closes.
9.2.3 Logging Data with the Graphic Data Logger
To log data:
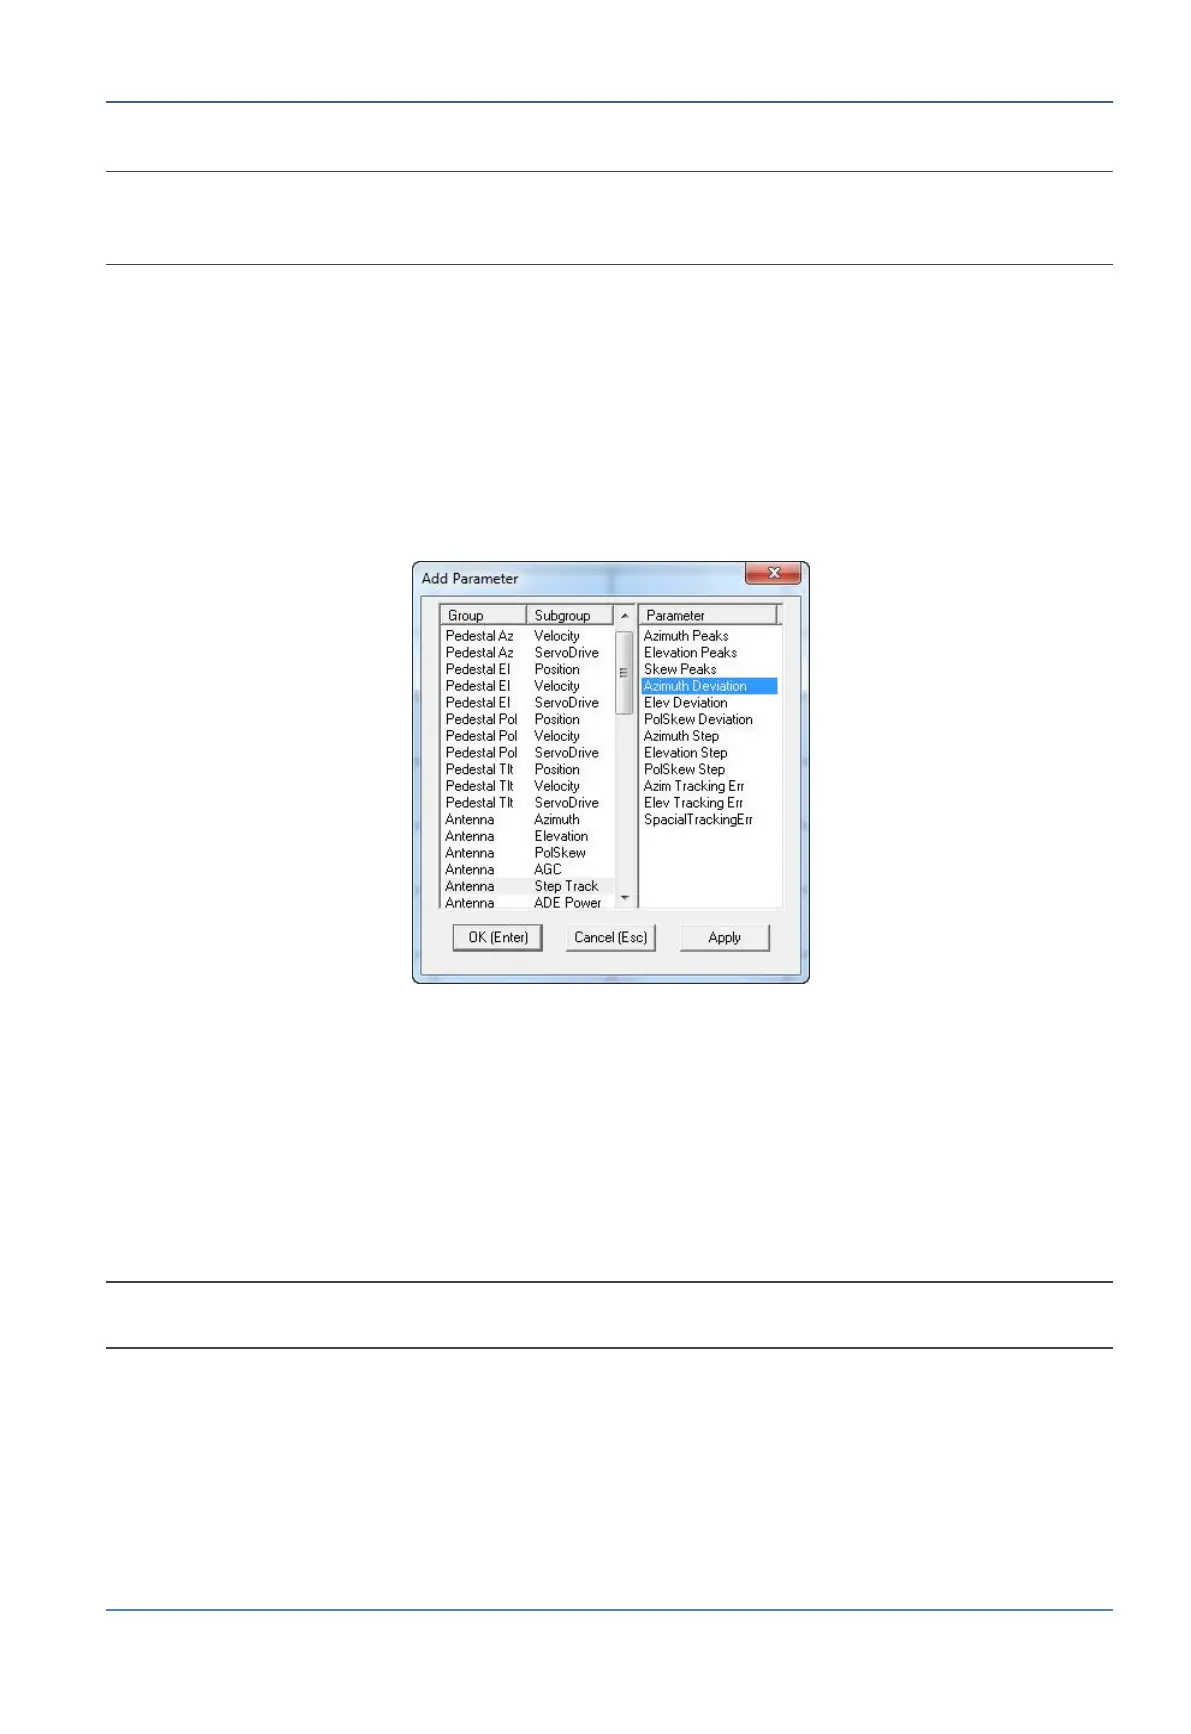
1. Open the Configuration & View menu and select Add Parameter (or press the <A>
key). The Add Parameter dialog box appears.
Figure 9-12: Add Parameter Dialog Box
2. Select a Group/Subgroup in the left-hand pane (for example, Antenna/Step Track),
then select the Parameter you wish to log in the right-hand pane (for example,
Azimuth Deviation).
3. Click OK (Enter). The parameter appears in the Logger control table.
4. To log additional parameters simultaneously, reopen the Add Parameter window
(press the <A> key) and repeat steps 2 and 3 for each parameter. The selected
parameters appear in the control table highlighted in a different color.
NOTE: To delete a parameter from the Logger control table, open the Configuration & View menu
and select Delete (or press the <D> key).