1-231
1
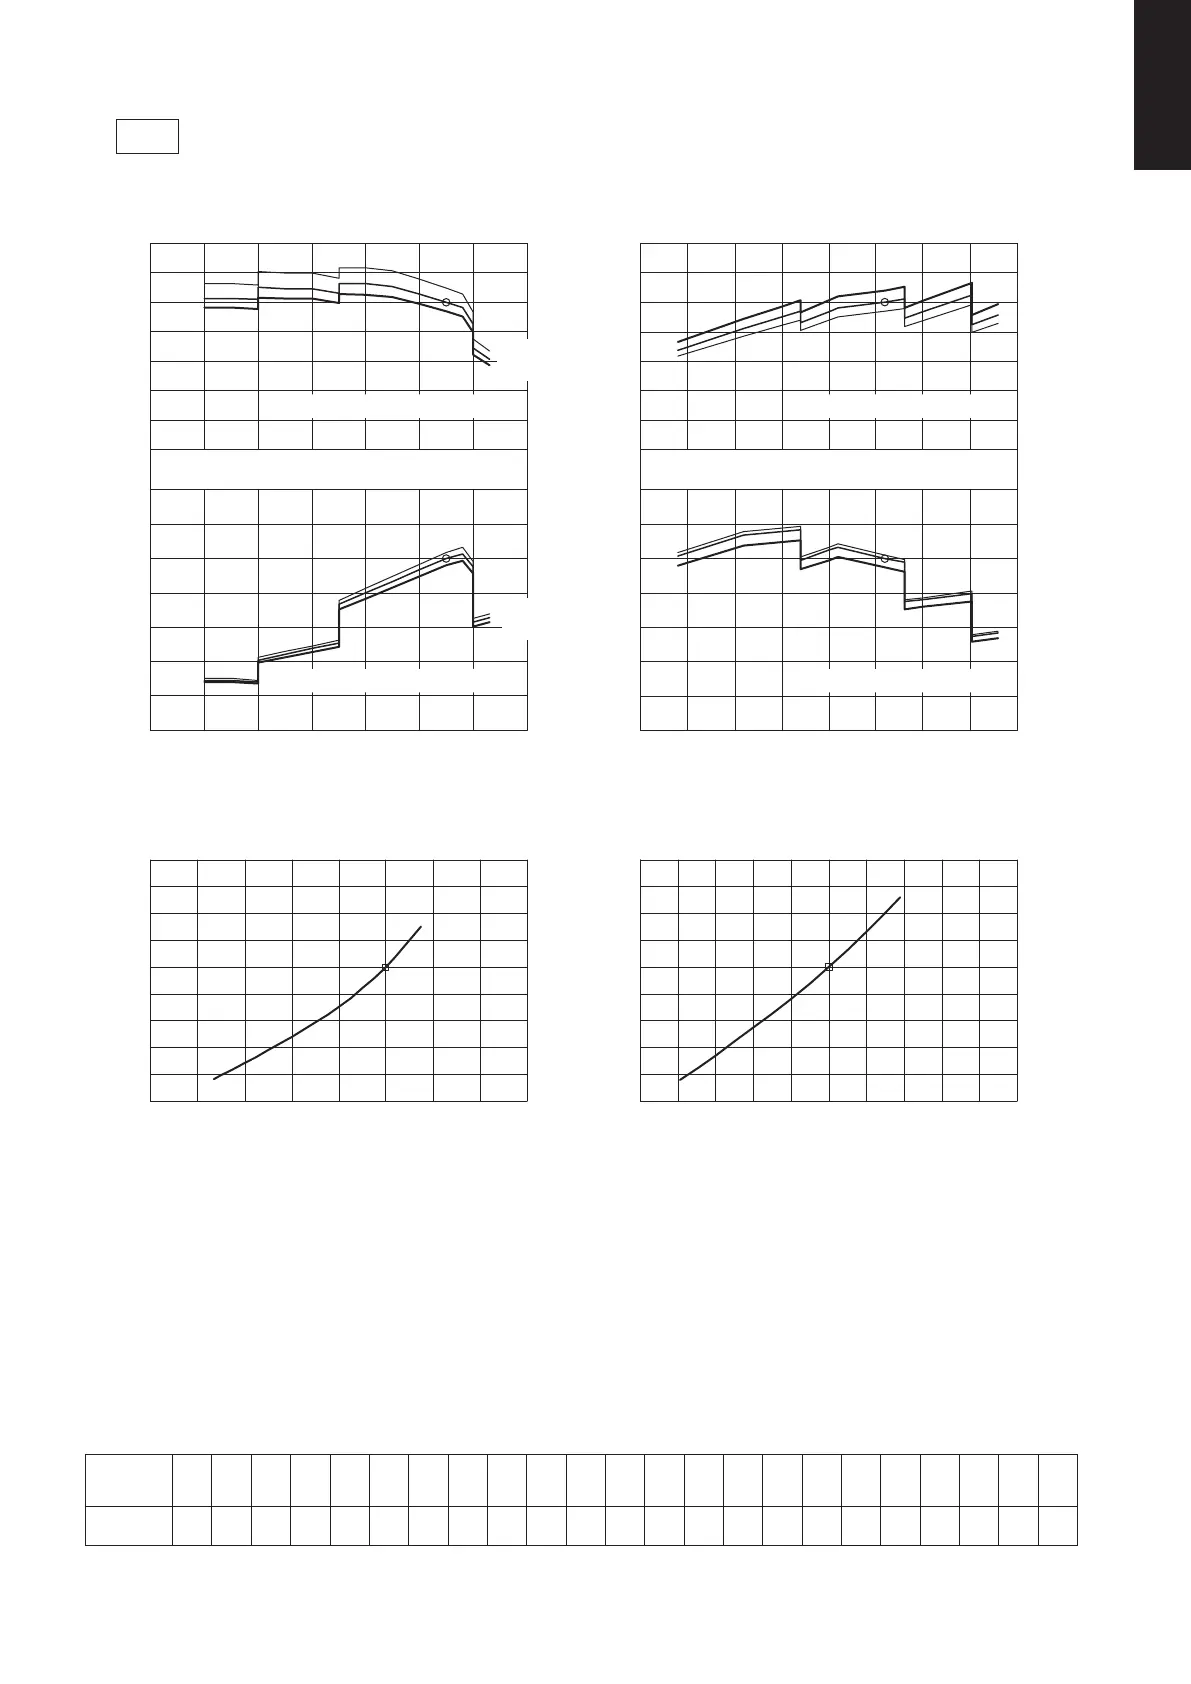
1-5. Capacity Correction Graph According to Temperature Condition
U-100PEY1E5 (For 50 Hz) / U-100PEY1E8 (For 50 Hz)
Heating capacity ratio (maximum capacity)
gnitaeHgnilooC
Capacity (kW) Capacity (kW)
PEY1
Input coefficient (%) Capacity coefficient (%)
Input coefficient (%)
Capacity coefficient (%)
Input coefficient (%)
Input coefficient (%)
Outdoor air intake temp ( °C WB) Outdoor air intake temp ( °C DB)
Outdoor unit heating capacity correction cofficient during of frosting/defrosting
To calculate the heating capacity with consideration for frosting/defrosting operation, multiply the heating capacity
found from the capacity graph by the correction coefficient from the table above.
(RH approximately 85%)
Correction
coefficient
Outdoor intake
air temperature
°C WB
0.86 0.86 0.86 0.86 0.86 0.86 0.86 0.86 0.86 0.86 0.86 0.84 0.84 0.82 0.8 0.8 0.82 0.84 0.86
-20 -15 -10 -9 0 1089-8-7-6-5-4-3-2-1 1234567
0.88 0.88 1 1
Cooling capacity ratio (maximum capacity)
20
0
40
60
80
100
140
120
20
0
40
60
80
100
120
140
-20-10 0 1020304050
22°CWB
19°CWB
16°CWB
22°CWB
19°CWB
16°CWB
20
0
40
60
80
100
120
140
180
160
0.0 2.0 4.0 6.0 8.0 10.0 12.0 14.0 16.0
140
20
0
40
60
80
100
120
16 °CDB
20 °CDB
24 °CDB
-20-15-10-5 0 5 101520
0
20
40
60
80
100
120
140
16 °CDB
20 °CDB
24 °CDB
0.0 2.0 4.0 6.0 8.0 10.0 12.0 14.0 16.0 18.0 20.0
0
20
40
60
80
100
120
140
160
180
Indoor air intake temp ( °C WB)
Indoor air intake temp ( °C DB)
Indoor air intake temp ( °C WB) Indoor air intake temp ( °C DB)
SM830231-02Single欧州.indb231SM830231-02Single欧州.indb231 2014/09/1913:21:392014/09/1913:21:39
 Loading...