15 APPENDIX FOR SCHEMATIC DIAGRAM
15.1. VOLTAGE AND WAVEFORM CHART
NOTE:
· Indicated voltage values are the standard values for the unit measured by the DC electronic circuit tester (high-impedance)
with the chassis taken as standard.
Therefore, there may exist some errors in the voltage values, depending on the internal impedance of the DC circuit tester.
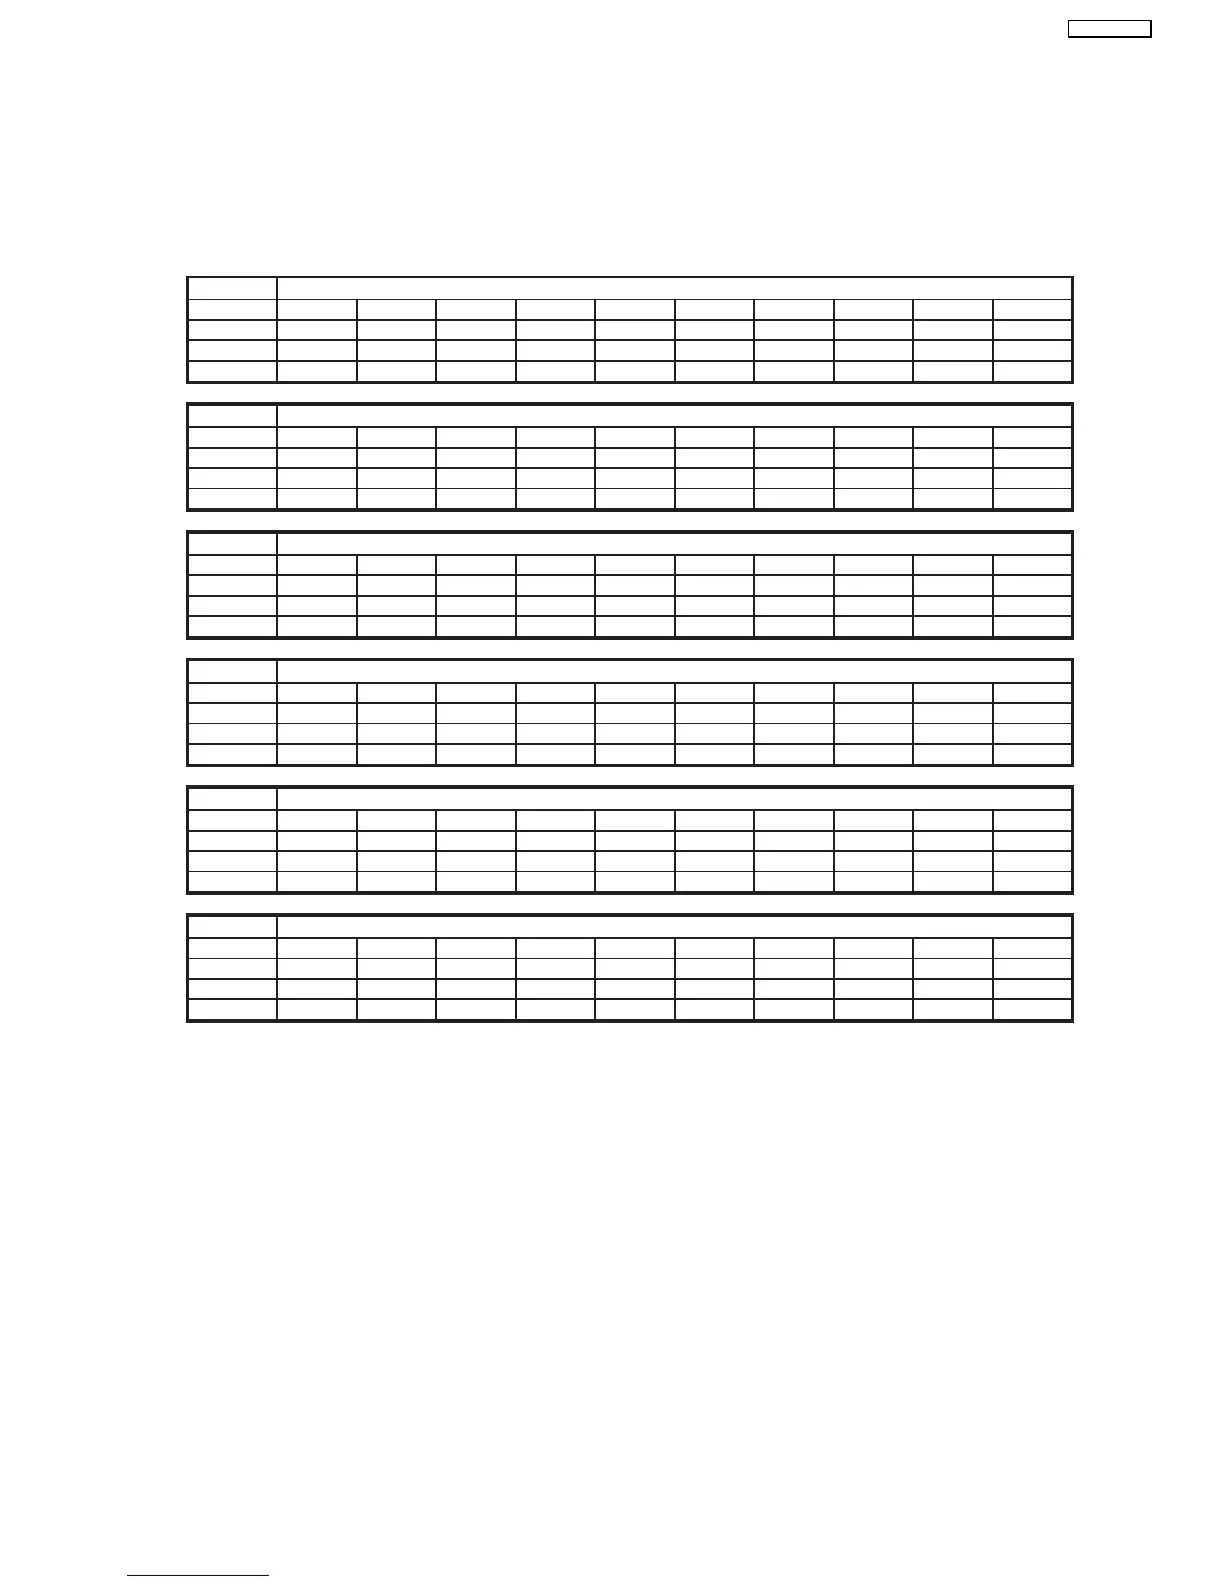
15.1.1. VOLTAGE CHART (IC1201 - IC2501)
Ref.No.
Mode12345678
Stop 12,32 4,45 1,20 1,26 0,75 0,00 6,54 12,30
Play 12,31 4,45 1,20 1,26 0,75 0,00 6,54 12,30
Rec. 12,31 4,45 1,19 1,26 0,72 0,00 6,54 12,29
Ref.No.
Mode12345678
Stop 12,32 0,03 1,29 4,16 0,00 1,18 0,76 5,21
Play 12,32 0,03 1,29 4,16 0,00 1,25 0,76 5,21
Rec. 12,31 0,03 1,29 4,15 0,00 1,25 0,76 5,21
Ref.No.
Mode12345678
Stop 12,32 0,04 1,28 4,15 0,04 1,11 0,76 3,84
Play 12,31 0,04 1,28 4,14 0,04 1,11 0,75 3,84
Rec. 12,31 0,05 1,28 4,14 0,04 1,10 0,75 3,84
Ref.No.
Mode12345678910
Stop 12,32 0,00 0,00 0,00 0,00 0,00 16,08 0,00 0,00 1,02
Play 12,32 0,00 0,00 0,00 0,00 0,00 16,08 0,00 0,00 1,02
Rec. 12,32 0,00 0,00 0,00 0,00 0,00 16,08 0,00 0,00 1,02
Ref.No.
Mode 11 12 13 14 15 16 17 18 19 20
Stop 3,82 0,00 0,05 5,05 2,47 2,47 2,47 2,47 5,02 0,75
Play 3,82 0,00 0,00 5,05 2,47 2,47 2,47 2,47 5,02 0,75
Rec. 3,82 0,00 0,00 5,05 2,47 2,47 2,47 2,47 5,02 0,75
Ref.No.
Mode 21 22 23 24 25
Stop 12,32 0,74 0,74 0,00 0,74
Play 12,32 0,74 0,74 0,00 0,74
Rec. 12,32 0,74 0,74 0,00 0,74
IC1201
IC1203
IC1204
IC2501
IC2501
IC2501
79
DMR-EZ45VEB
 Loading...