Preparation
29
VQT0S19
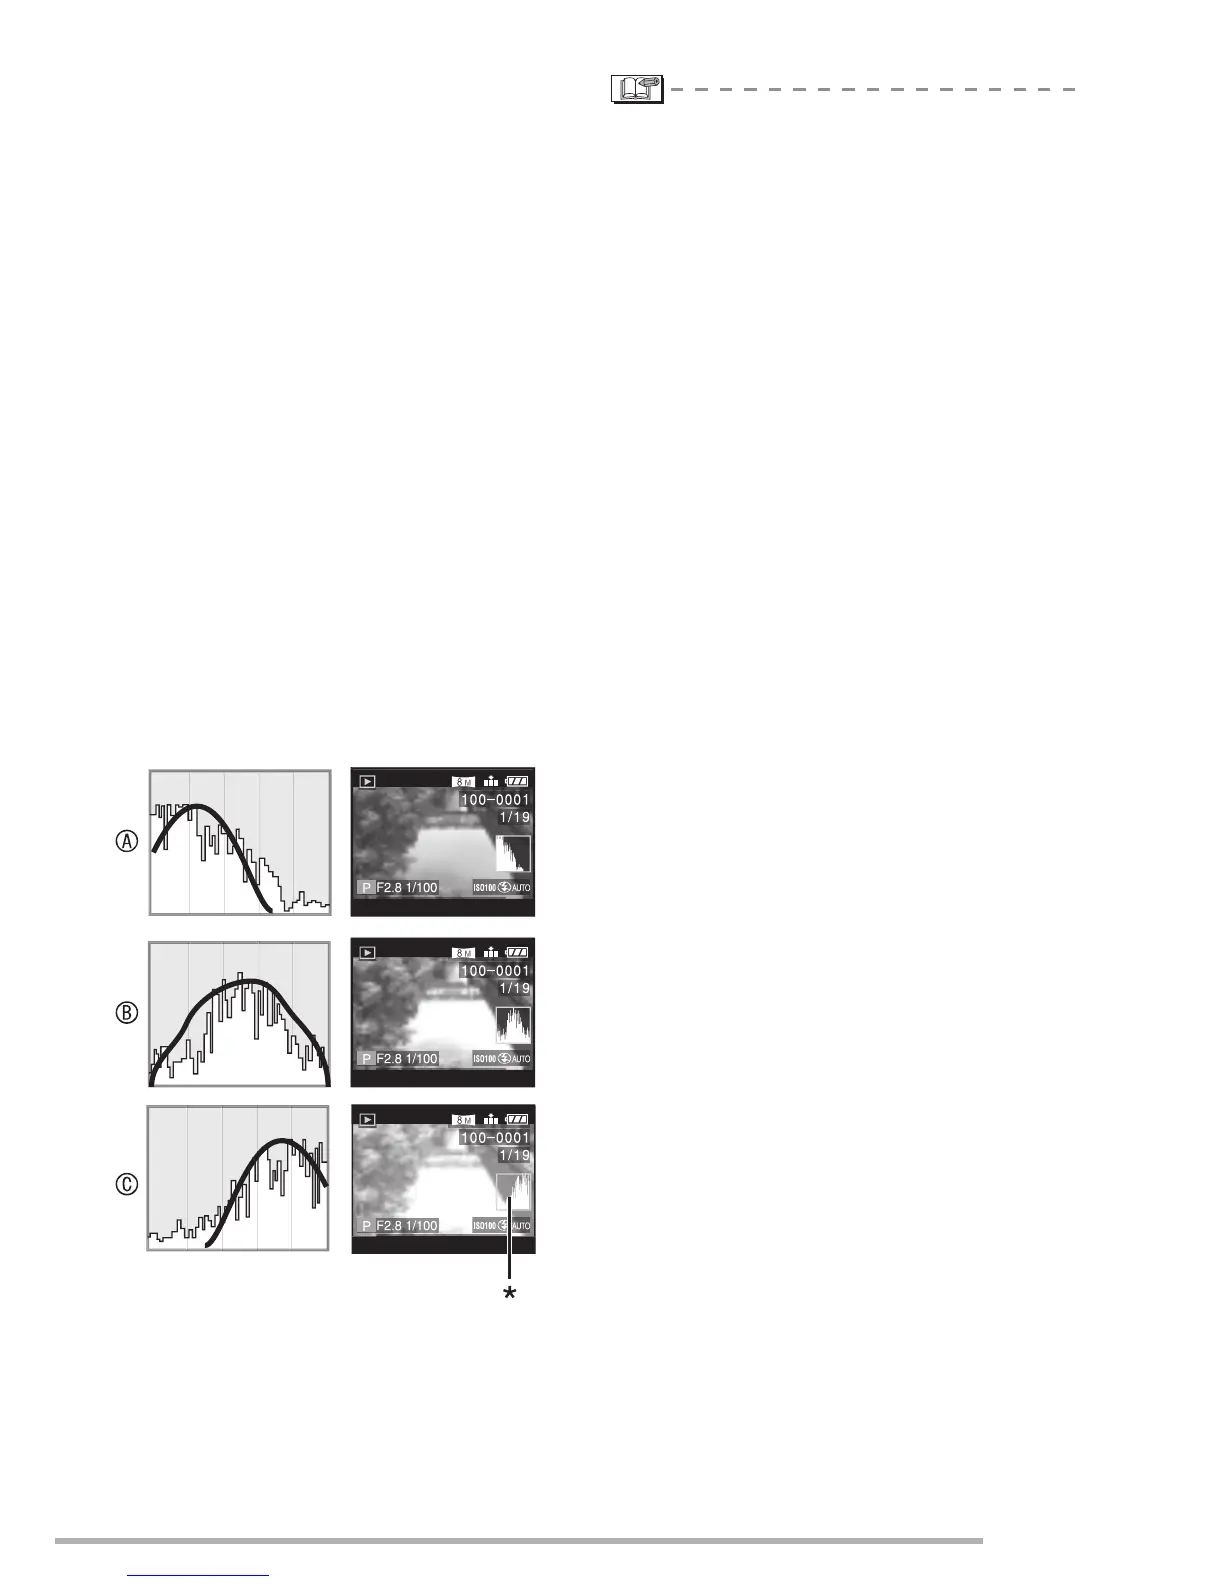
n Histogram
• A histogram is a graph that displays
brightness along the horizontal axis (black
to white) and the number of pixels at each
brightness level on the vertical axis.
• It allows the camera user to easily check
the way a picture is being exposed.
• When the values are concentrated to the
left
A, the picture is under exposed.
Pictures that are mostly black, such as
night scenery, forms this type of
histogram.
• When the values in the histogram are
distributed evenly
B, the exposure is
adequate and the brightness is well-
balanced.
• When the values are concentrated to the
right
C, the picture is over exposed.
Pictures that are mostly white, forms this
type of histogram.
Example of histogram
A Under Exposed
B Properly Exposed
C Over Exposed
*Histogram
• When the recorded picture and the
histogram do not match each other
under the following conditions, the
histogram is displayed in orange.
–When the flash is activated
–When the flash is closed
1 When the brightness of the screen is
not correct in dark places
2 When the exposure is not adequately
adjusted
• The histogram does not appear when in
motion picture mode [i], during multi
playback and playback zoom.
• The histogram in the recording mode is an
approximation.
• The histogram in recording and playback
may not match each other.
• The histogram in this camera does not
match the one displayed in image editing
software used with a PC, etc.
• Check white saturated areas with the
highlight display in the auto review
function or the review function. (P28)
10:00
DEC.20.2005
10:00
DEC.20.2005
10:00
DEC.20.2005
 Loading...