Installer Manual Autotrol 368 / 604-606 - Description
12 / 54 Ref. MKT-IM-007 / A - 16.12.2016
3.1.1. Performance flow rate characteristics
The graph shows the pressure drop created by the valve itself at different flow rates. It makes it
possible to predetermine the maximum flow rate going through the valve depending on the system
settings (inlet pressure etc). It also makes it possible to determine the valve pressure drop at a given
flow rate, and therefore to evaluate the system pressure drop vs flow rate.
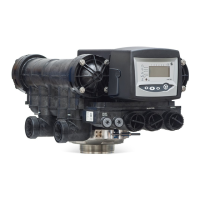
3.2. Outline drawing
Flow rate (m
3
/h)
Flow rate (GPM)
Pressure drop in barPressure drop in psi
Flow rate (m
3
/h)
Pressure drop in bar
Flow rate (GPM)
Pressure drop in psi
Service Kv = 3.7 BW Kv = 0.48
Service Cv = 4.3 BW Cv = 0.56
 Loading...