The following describes the display of data acquired:
Figure 47.
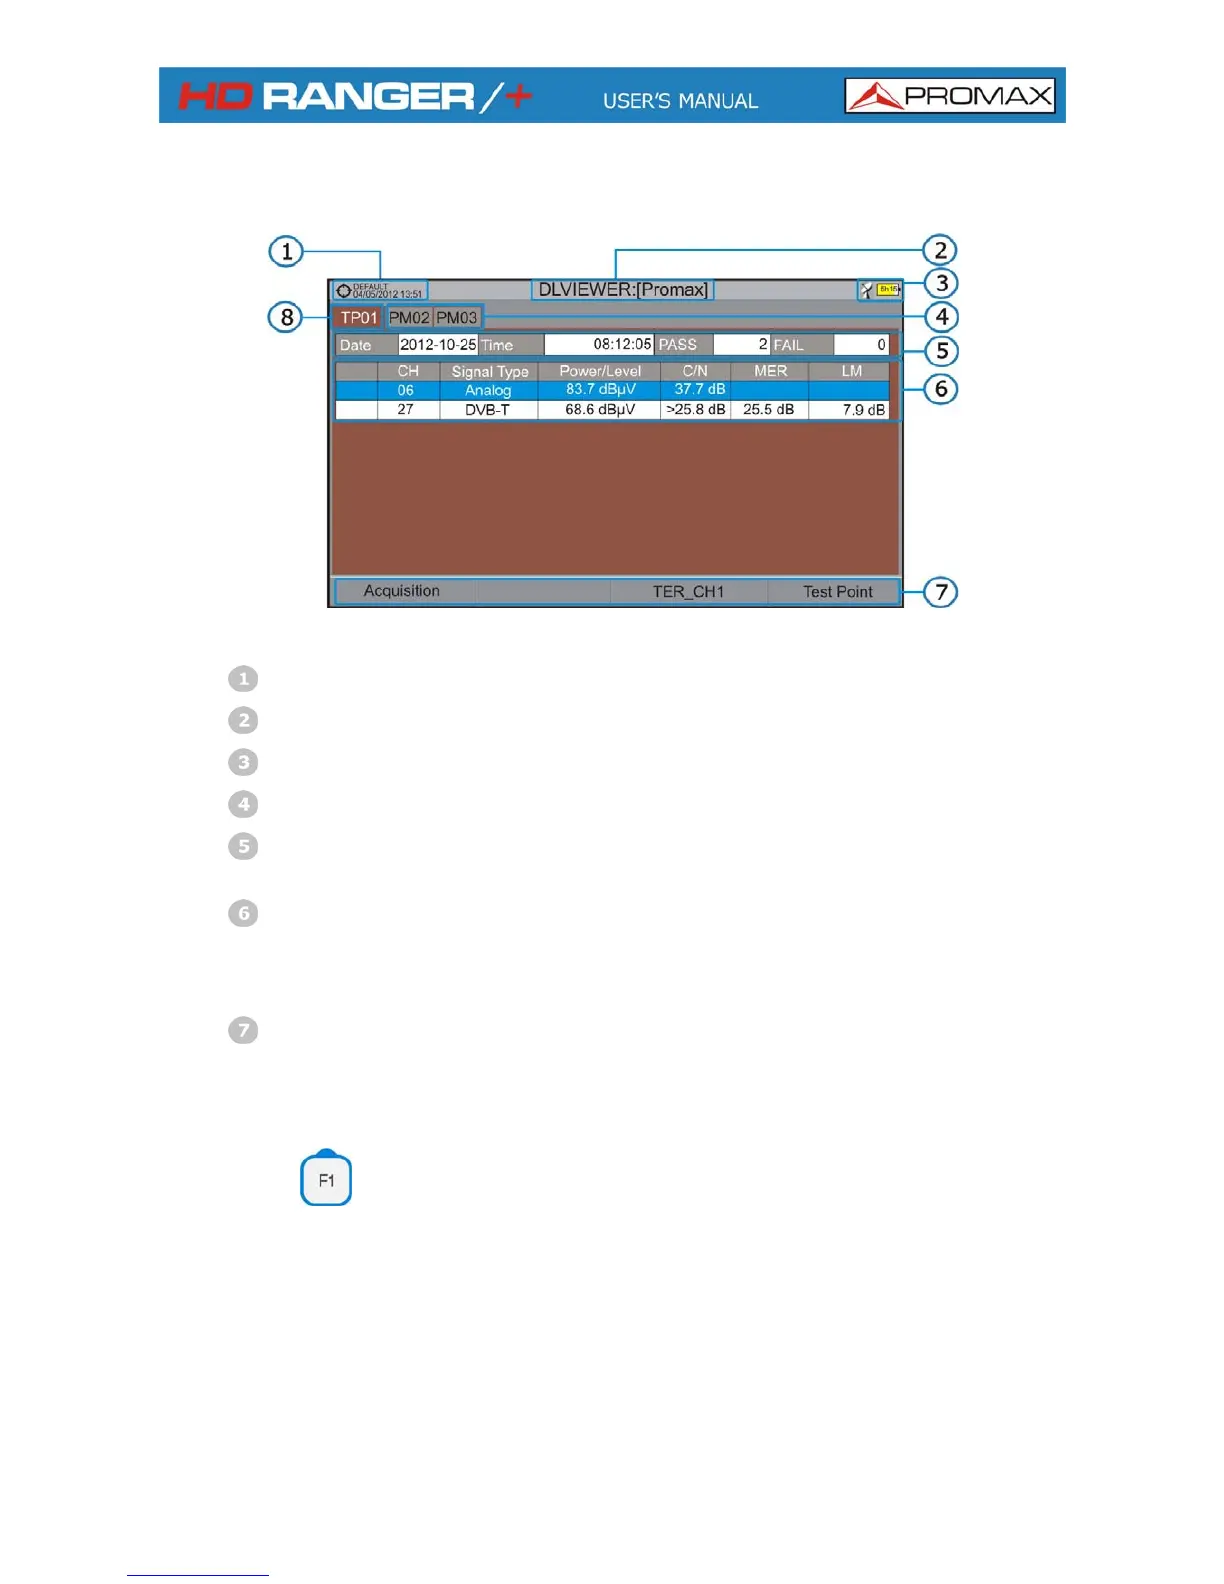
Selected installation; date and time.
Current datalogger name.
Selected band; battery level.
Tab identifying each test point.
Date and time when the datalogger was created. Number of channels
locked (PASS) or not locked (FAIL)
Data table with measurement data for each channel. In order from left to
right: Colour identifying if the channel has been locked (WHITE) or not
locked (RED) channel; signal type; power/level; Carrier/Noise (C/N) rate;
MER; Link Margin.
Softkey menus. Move the joystick up or down to navigate along the
measurement data. Press the joystick on a channel to display the signal
parameters.
Acquisition
It contains two options:
Start: It starts the datalogger in the selected test
point.
Clear: It deletes the data in the selected test
point.
April 2013
6-75
 Loading...