Diagnostics and Troubleshooting MVI56E-GSC/GSCXT ♦ CompactLogix or MicroLogix Platform
User Manual Enhanced Generic ASCII Serial Communication Module
Page 66 of 140 ProSoft Technology, Inc.
April 24, 2017
3.5.3 Data Analyzer Tips
For most applications, HEX is the best format to view the data, and this does
include ASCII based messages (because some characters will not display in the
Diagnostics window in ASCII mode, and, by capturing the data in HEX, you can
figure out what the corresponding ASCII characters are supposed to be).
The Time Tick value is a timing mark. The module will print a _TT_ every so
many milliseconds. The Time Tick setting is adjustable in the Data Analyzer
Setup dialog box. Usually 10 milliseconds works best for most applications.
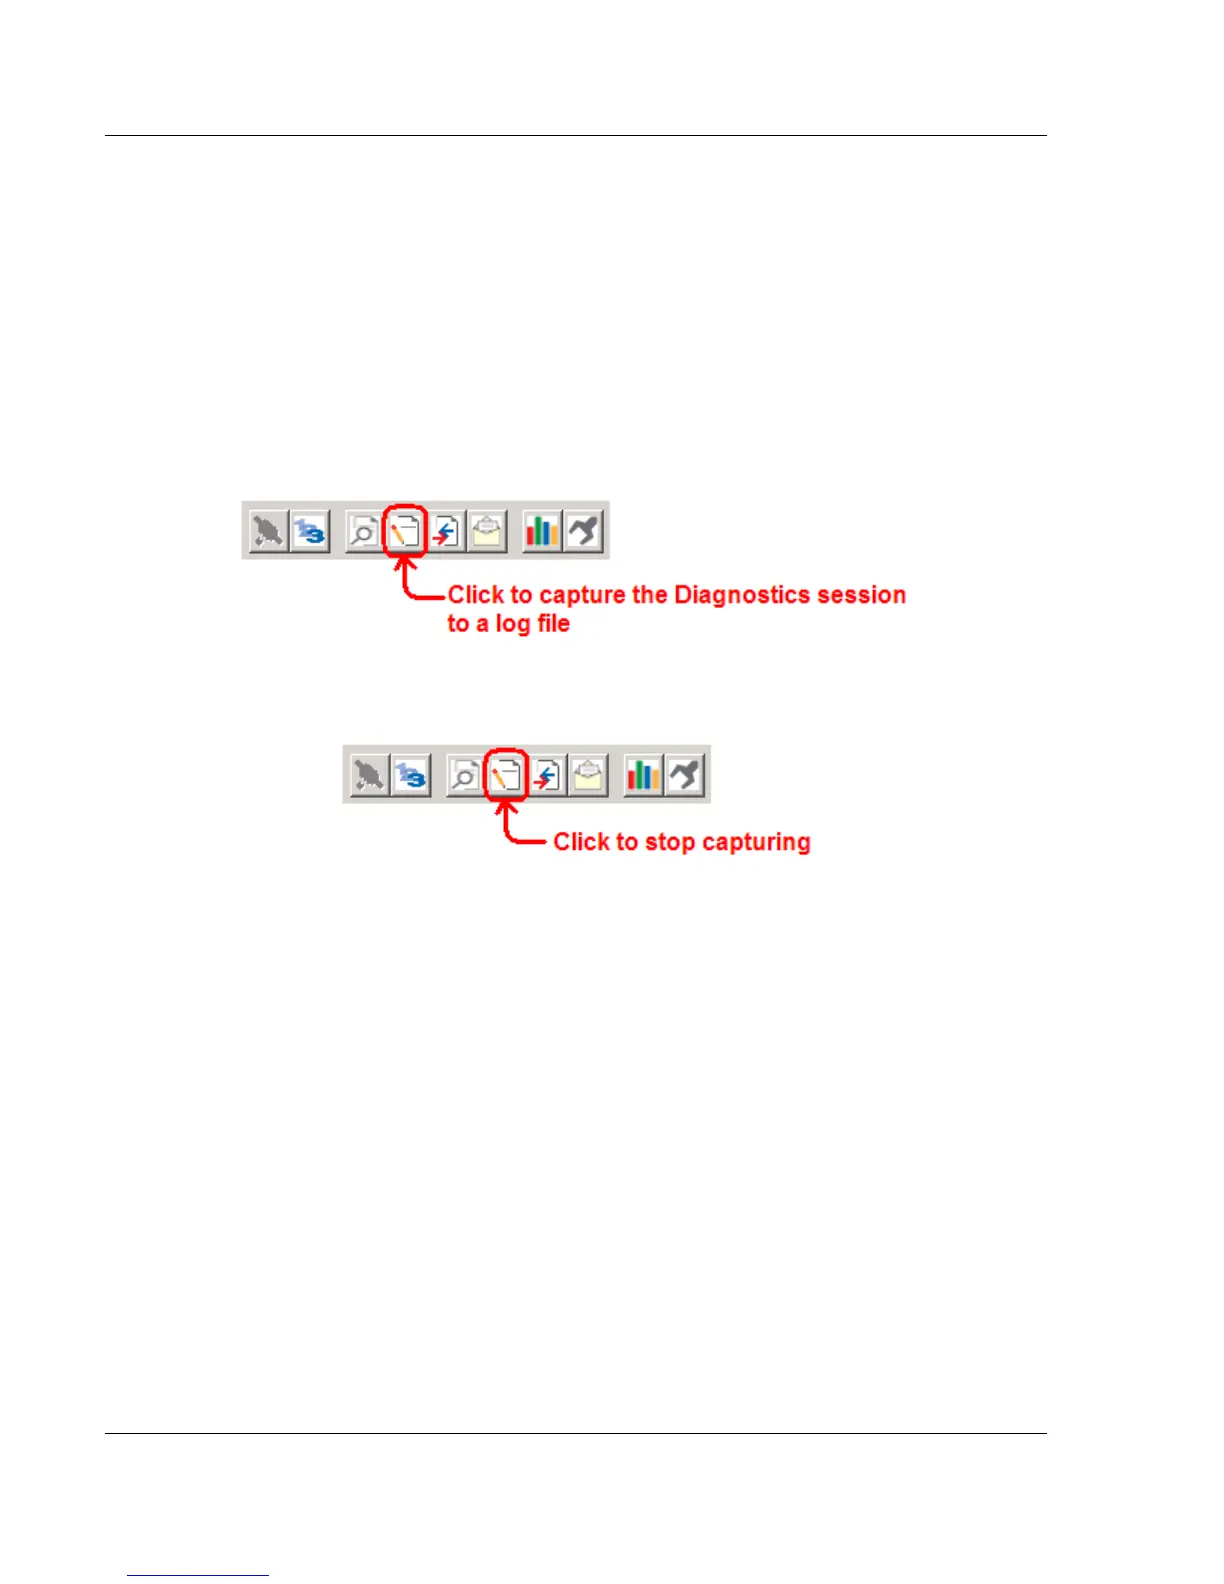
To save a capture file of your Diagnostics session
1 After you have selected the Port, Format, and Tick, you are now ready to
start a capture of this data.
2 When you have captured the data you want to save, click again to stop
capturing data.
You have now captured and saved the data to a file on your PC. This file can
now be used in analyzing the communication traffic on the line and assist in
determining communication errors. The log file name is PCB-Log.txt, located in
the root directory of your hard drive (normally Drive C).
Once you have everything that shows up on the Diagnostics screen being logged
to a file called PCB-Log.txt, you can email this file to ProSoft Technical Support
for help with the analysis of communication problems.