ABL800 FLEX Reference Manual 5. Performance characteristics
Performance test results - bilirubin, Continued
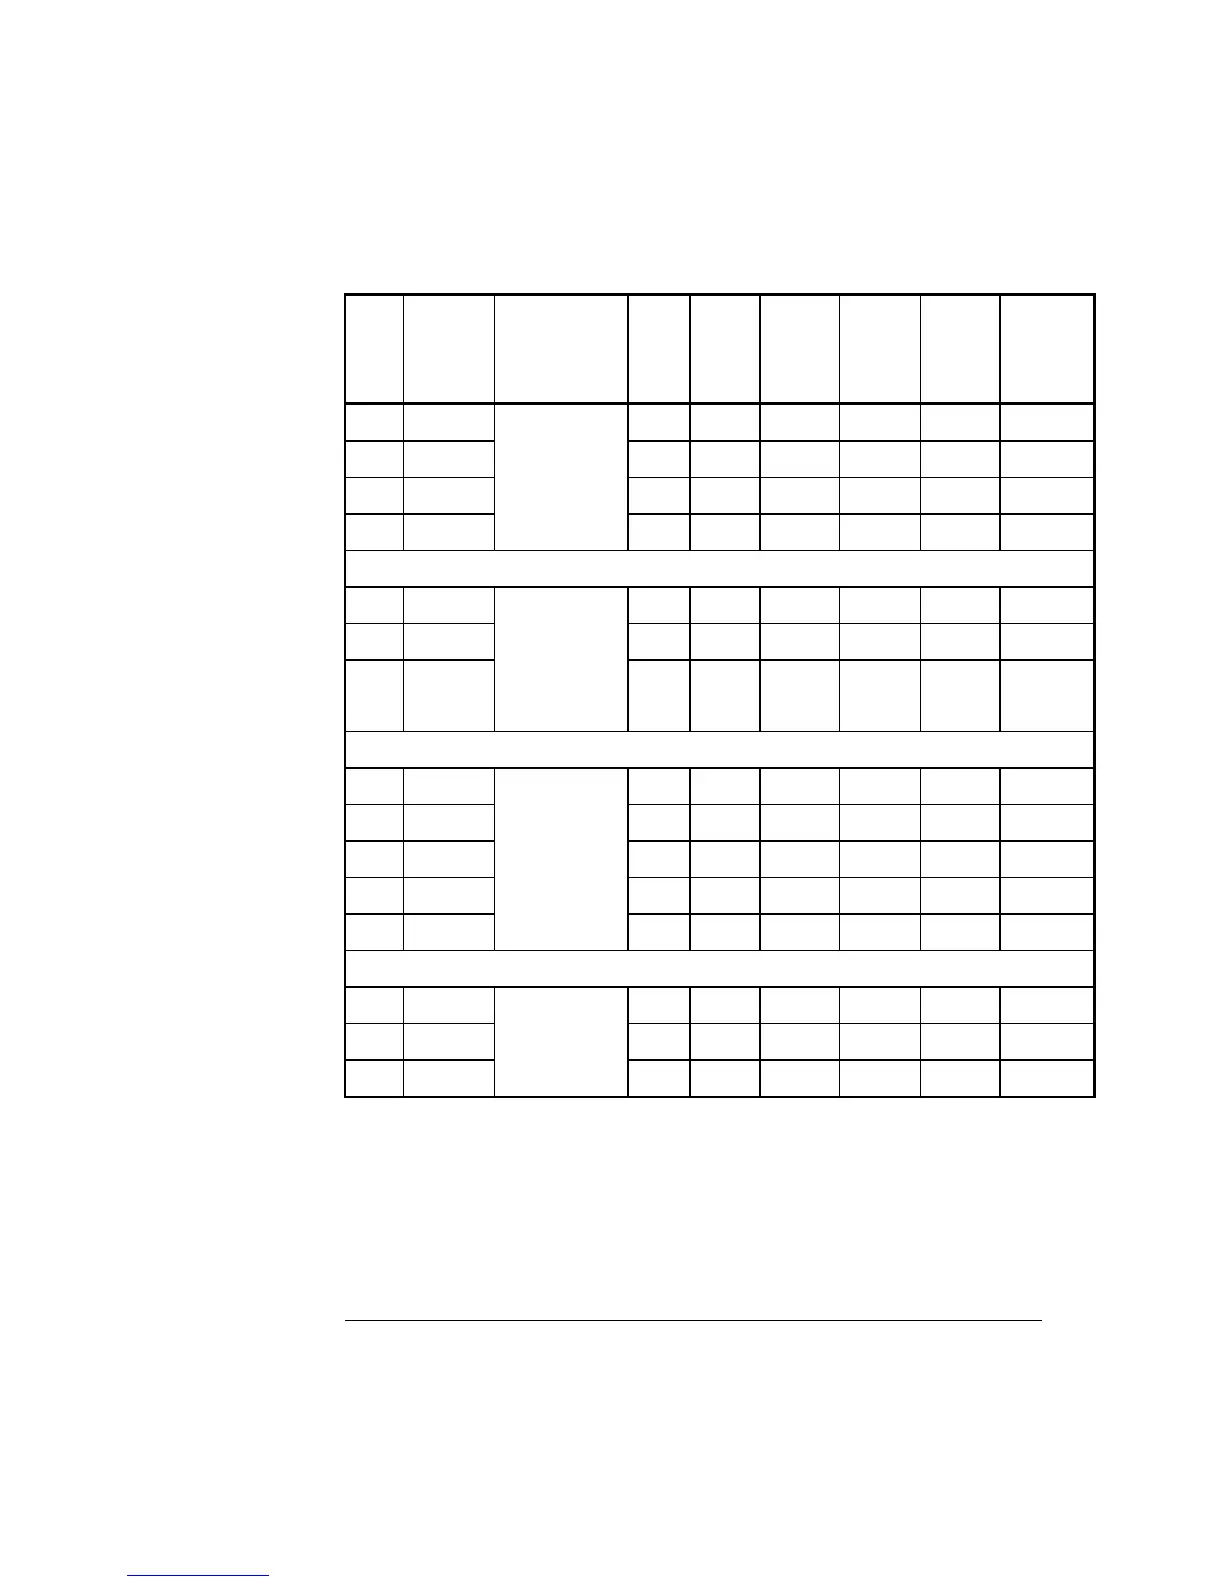
Field test results
(continued)
The field test results are given below.
Pos. Field test
place
Type N Slope Inter-
cept
µmol/L
R
2
S
yx
µmol/L
Range
µmol/L
1 A 46 1.026 0.0 0.9914 5.1 18 – 258
2 B 56 0.986 –1.3 0.9939 5.8 10 – 334
3 D 4 1.014 –1.4 0.9984 4.5 22 – 236
4 E
Plasma,
neonatal
47 0.945 1.2 0.9937 5.1 4 – 253
5 D Plasma, 16 0.950 –0.5 0.9977 5.2 18 – 313
6 B adult 59 0.924 1.4 0.9981 3.8 2 – 366
7 F 52
45 (a)
0.904
0.942
5.6
2.6
0.9932
0.9941
12.0
5.3
4 – 635
4 – 300
8 A 46 1.075 9.6 0.9661 10.7 18 – 258
9 B 100 1.057 –1.6 0.9819 12.0 3 – 297
10 D 32 1.000 –5.6 0.9715 14.4 3 – 254
11 C 52 0.993 –5.0 0.9790 11.3 6 – 309
12 E
Blood,
neonatal
47 1.019 –10.2 0.9827 9.5 4 – 253
13 D Blood, 18 0.950 –6.8 0.9974 5.6 18 – 313
14 B adult 55 0.909 3.2 0.9974 4.6 2 – 366
15 F 25 0.939 4.9 0.9967 10.0 21 – 635
Regression table: Regression results from field tests. N = #samples, S
yx
is standard
deviation about regression line.
NOTE: (a) Datasubset excluding samples above 300 µmol/L.
Continued on next page
5-41
 Loading...