5. Performance characteristics ABL800 FLEX Reference Manual
Performance test results - bilirubin, Continued
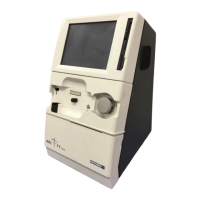
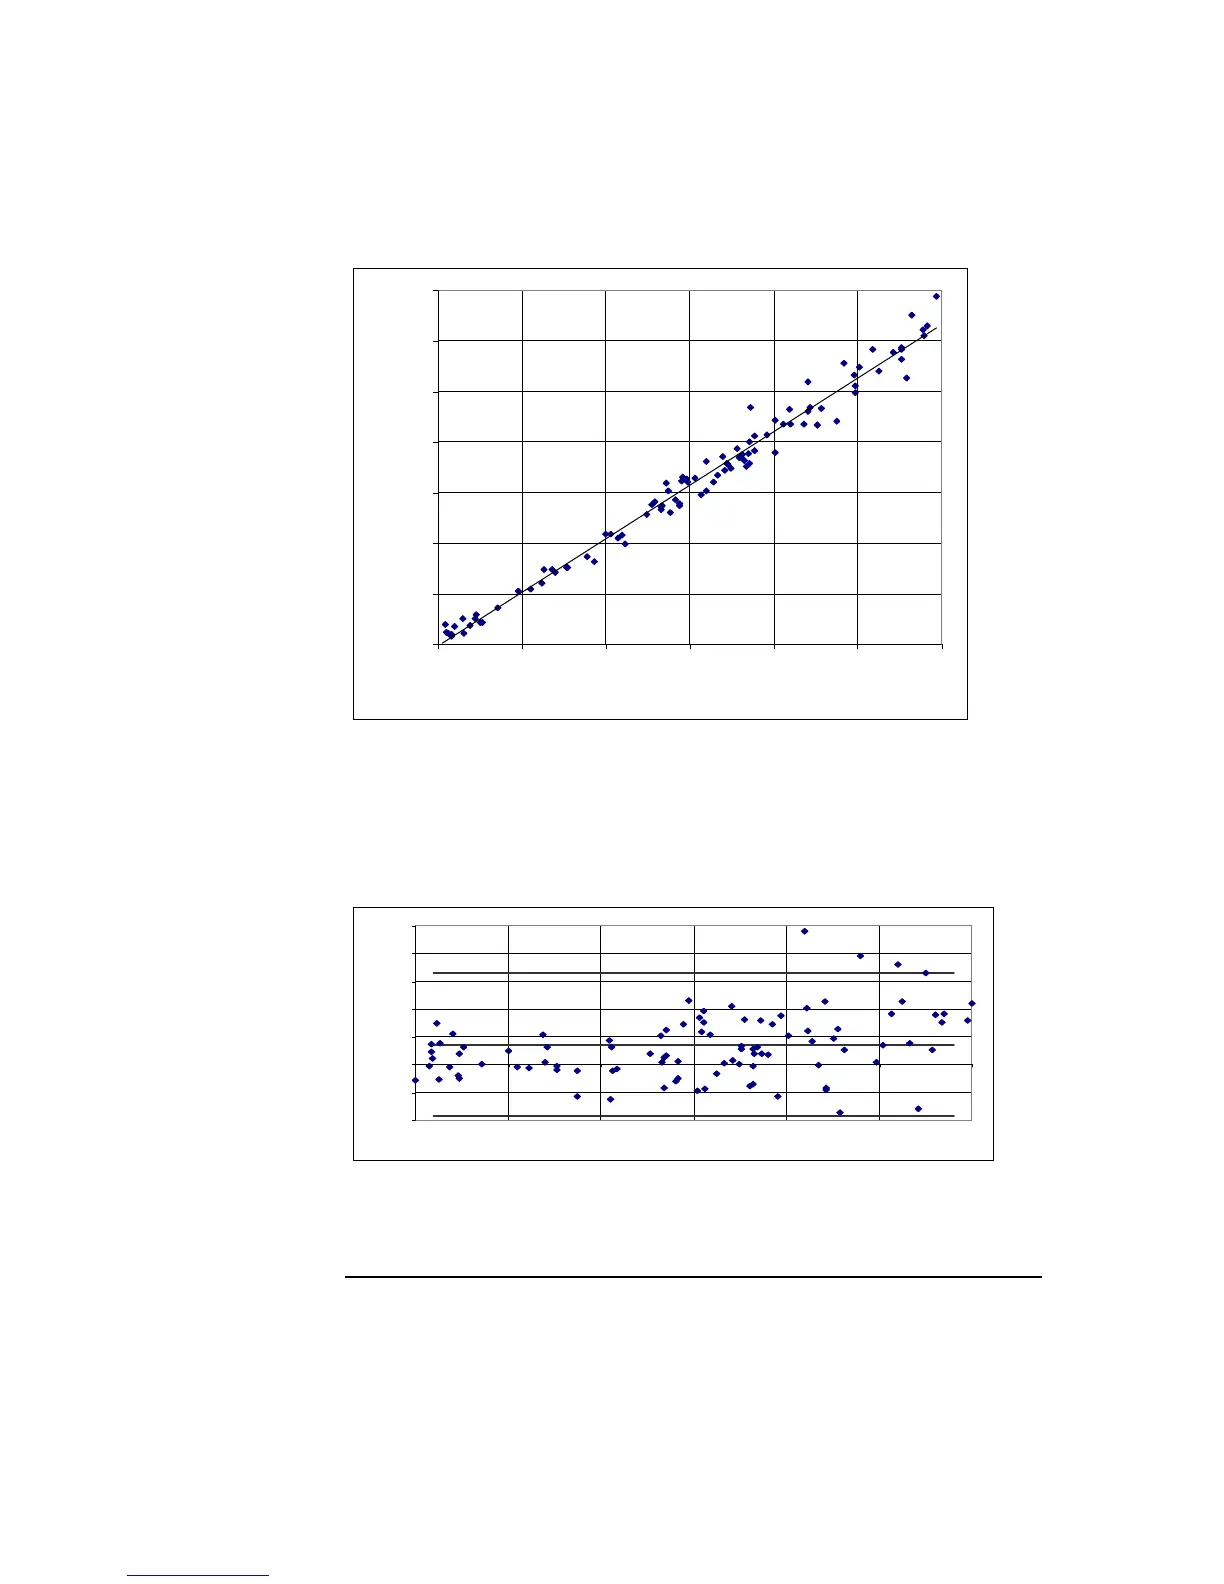
Regression and
Bland-Altman
plot
Data set position 9 from regression table.
y = 1.0572x - 1.6119
R
2
= 0.9819
0
50
100
150
200
250
300
350
0 50 100 150 200 250 300
Hitachi, NIST
ABL735
Syx=12.0
Actual field test from a neonatal critical care hospital using whole blood. Values
are in µmol/L.
The same data as above but depicted in a Bland-Altman plot below.
-20
-10
0
10
20
30
40
50
0 50 100 150 200 250 300
ctBil
Difference
Lines indicate Mean, Mean+2SD and Mean-2SD. Values are in µmol/L.
Difference = ABL835 – Hitachi,NIST.
Continued on next page
5-42
 Loading...