48
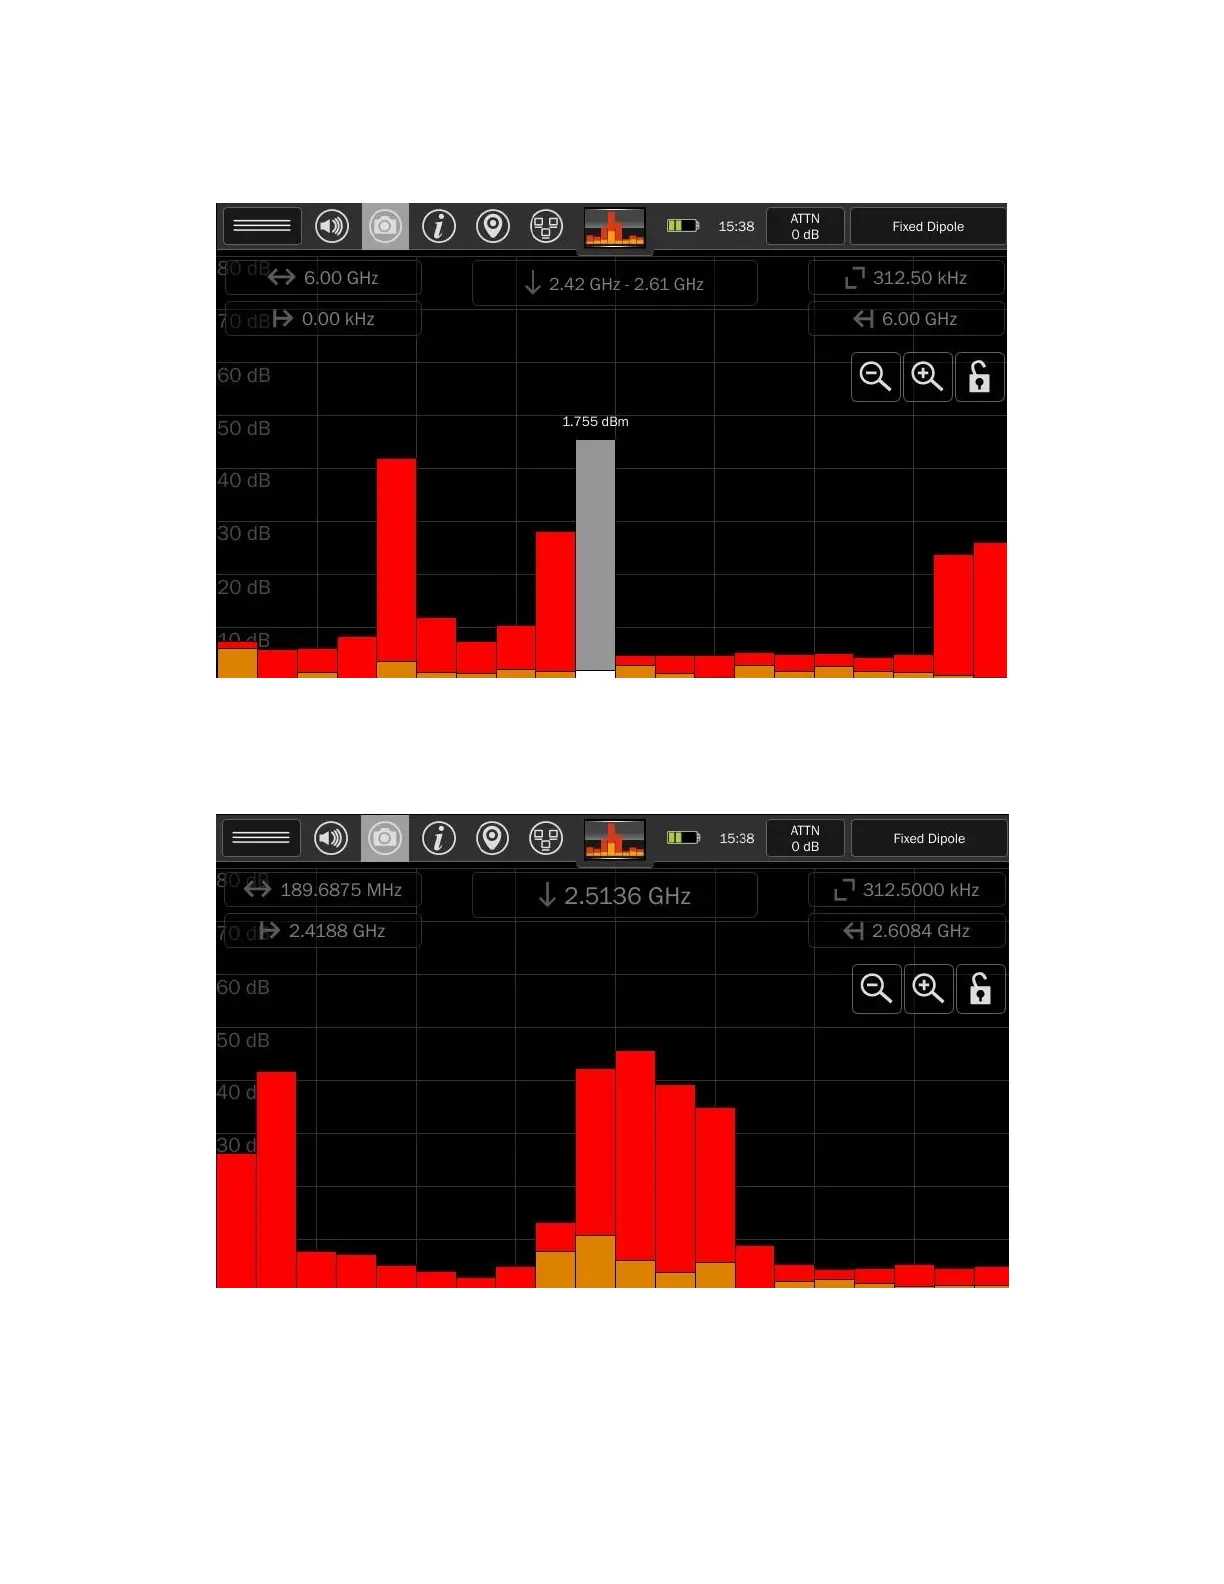
Tapping a SmartBar will select it. The selected peak trace bar will change to gray. The selected live trace
bar will change to white.
Tapping a selected SmartBar will zoom in to the portion of the spectrum represented by the span of the
selected SmartBar. Again, the portion of the spectrum will be displayed as 20 sub-bars of equal power.
Notice the spectrum indicators at the top of the screen (span, start frequency, stop frequency). These
will change to indicate the new span.
 Loading...