49
Tapping one of the sub-bars will select it. Tapping a selected sub-bar will zoom in to the portion of the
spectrum represented by the span of the sub-bar displayed as a trace graph.
(To return to the SmartBars view, repeatedly press Zoom Out until the displayed span is greater than
200 MHz. Changing the Span directly by tapping the Span Indicator at the top of the screen and changing
the value to one that is greater than 200 MHz will also accomplish this.)
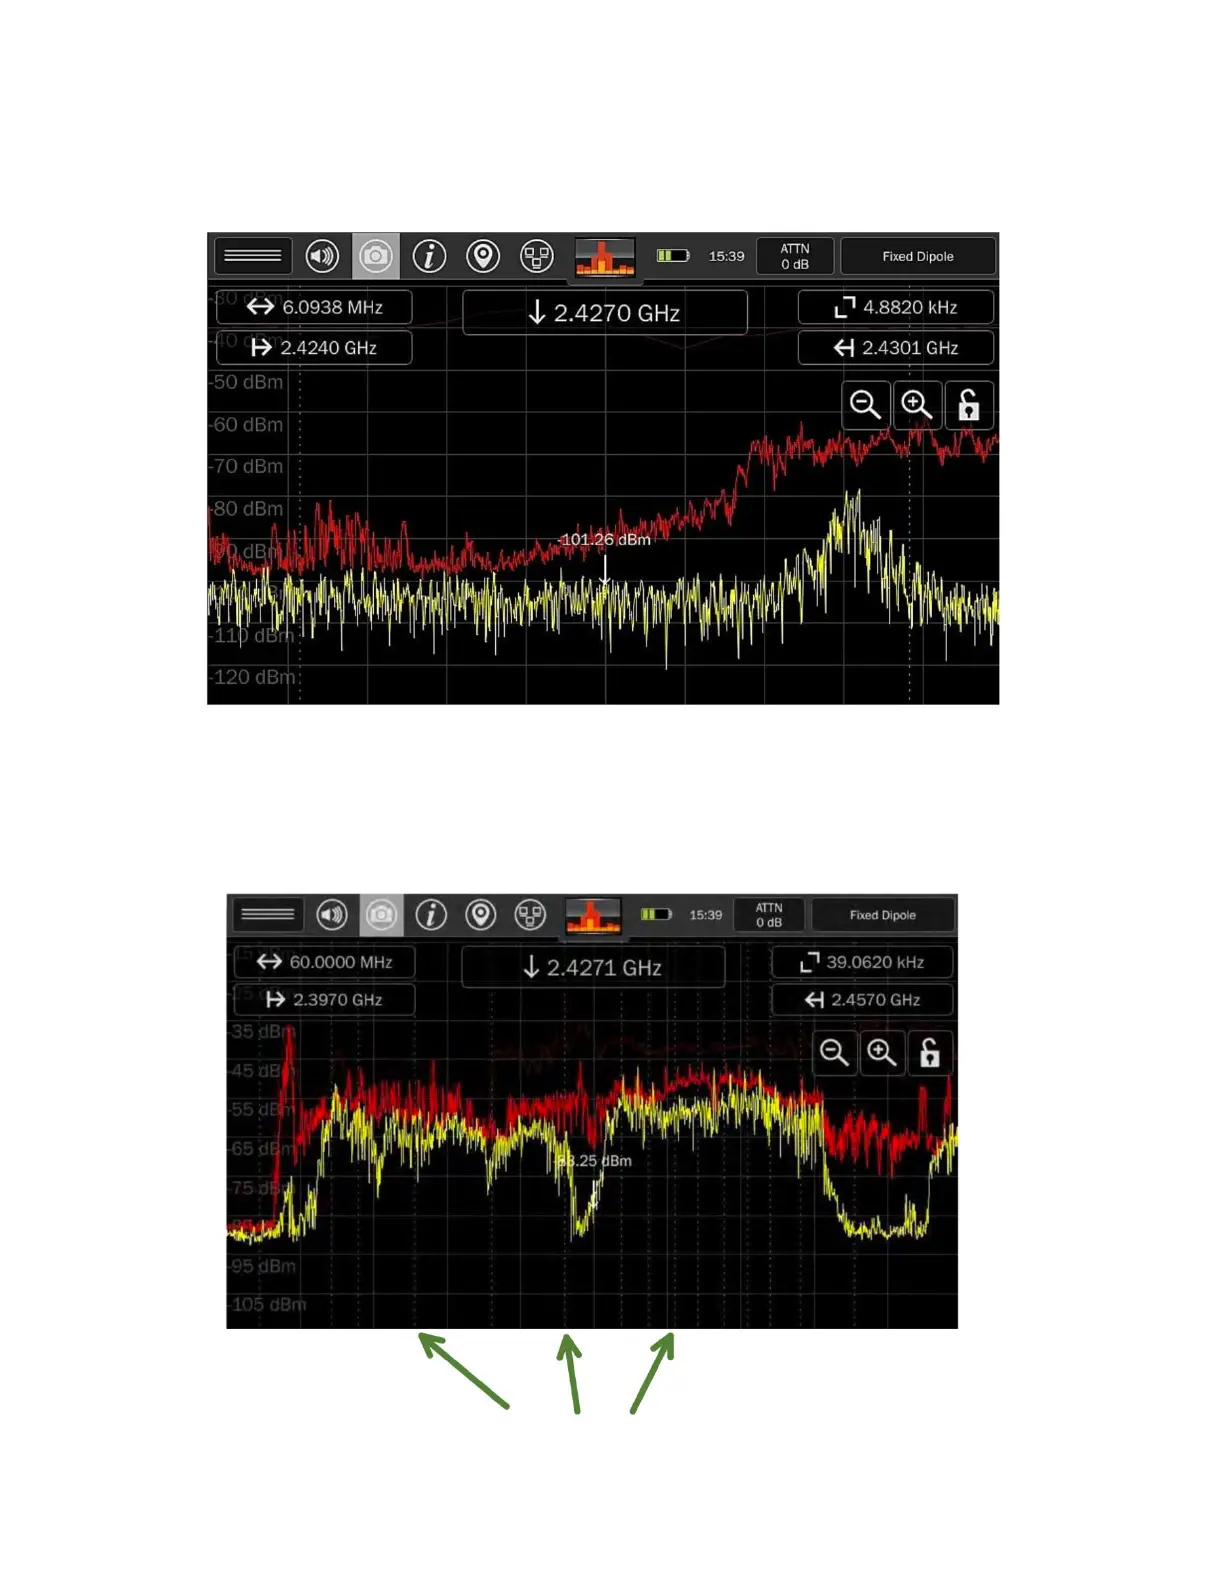
When displaying the spectrum, vertical green lines represent the boundaries of the SmartBars.
 Loading...