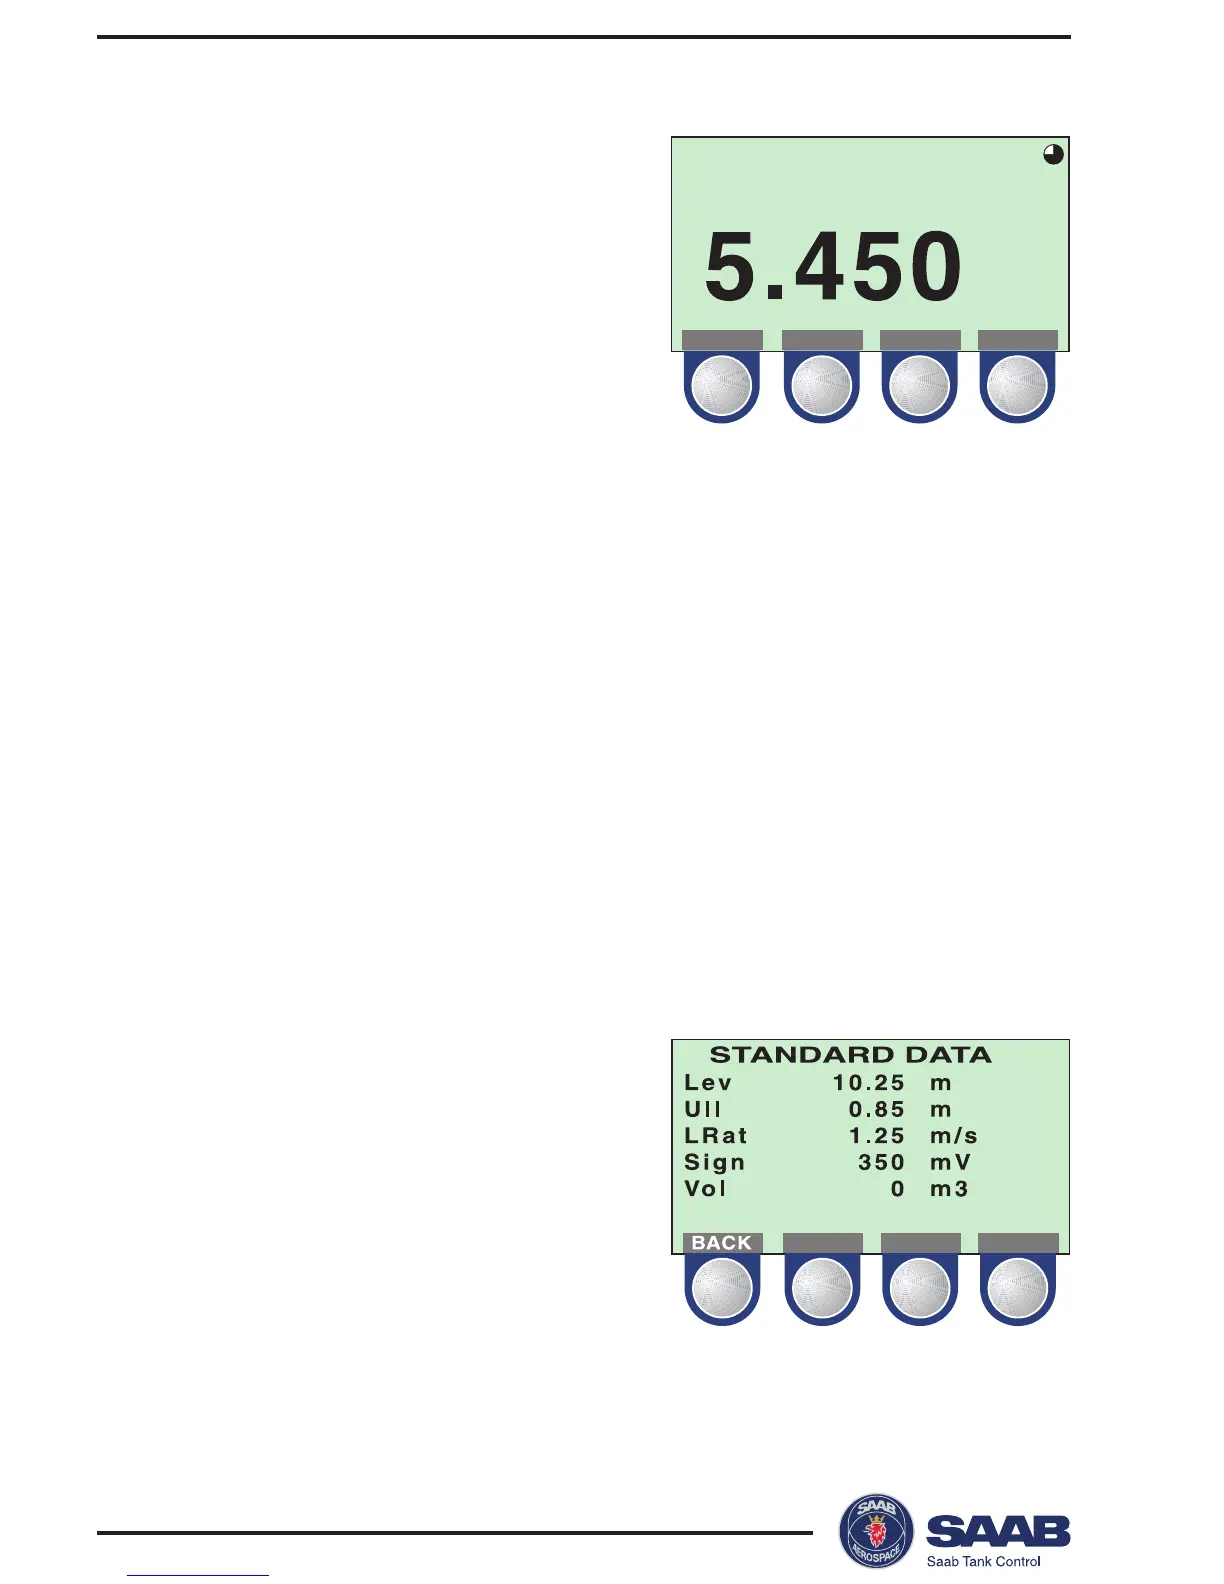
Display
Select the Display submenu to view
measured data:
Press the ITEM button to choose
between the different options:
• Level
• Ullage
• Level Rate
• Volume
• Signal Strength
The GRPH button allows you to switch between display modes:
Numerical measured data is presented as a value.
Bargraph the measured value is presented in a bar
graph showing the current value.
Trend a set of vertical lines are displayed represent-
ing values sampled at a predefined rate. See
Display Panel Setup for descriptions on how to
set up the trend display.
Standard Data
Select the Standard Data option
from the View menu to view a list
of measured variables.