EB 8389 EN 31
Statistical information
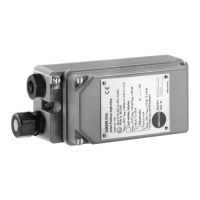
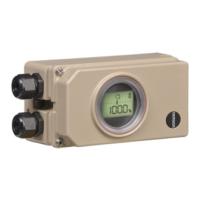
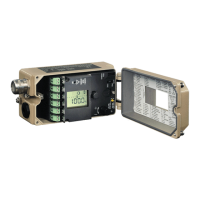
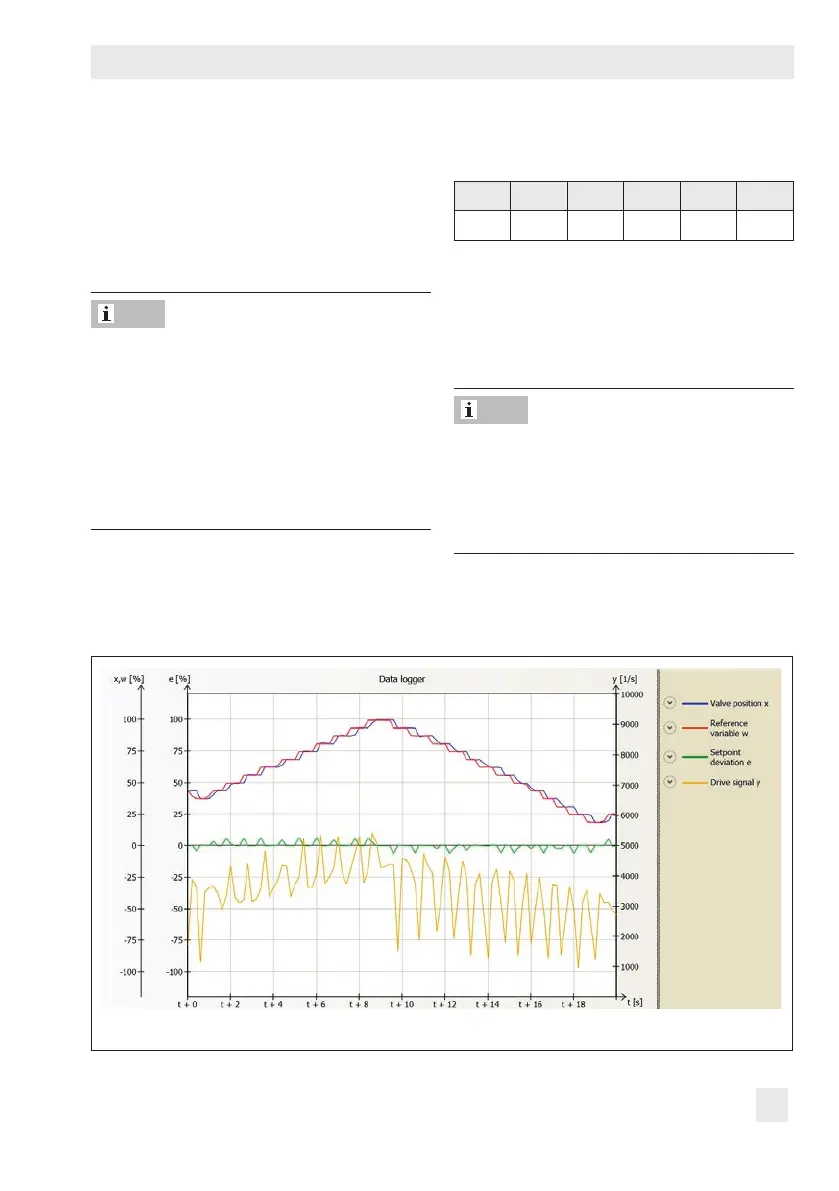
4.2 Data logger
The data logger records the measured vari-
ables (valve position x, set point w, set point
deviation e and drive signal y). The recorded
data are plotted against time in a graph.
The data logger is interrupted and must be
reactivated when one of the following events
occurs.
− Change of the operating mode
− Air supply failure
− Failure of power supply of the positioner
− Failure of power supply of the external so-
lenoid valve
4.2.1 Permanent data logging
3730-2 3730-3 3731-3 3730-4 3730-5 3731-5
• • • •
1)
1)
Function available in rmware 1.5x and lower
The measured variables are logged at the
rate dened in 'Scan rate' and saved in a
circular buffer, which holds 100 data points
per measured variable at one time.
You can read the measured data logged
over the past 24 hours from the 'Data log-
ger' graph when the Diagnosis folder (> Sta-
tistical information > Data logger) is left
open over this period.
Note
Note
Fig.2: Diagnosis > Statistical information > Data logger
 Loading...