EB 8389 EN 49
Statistical information
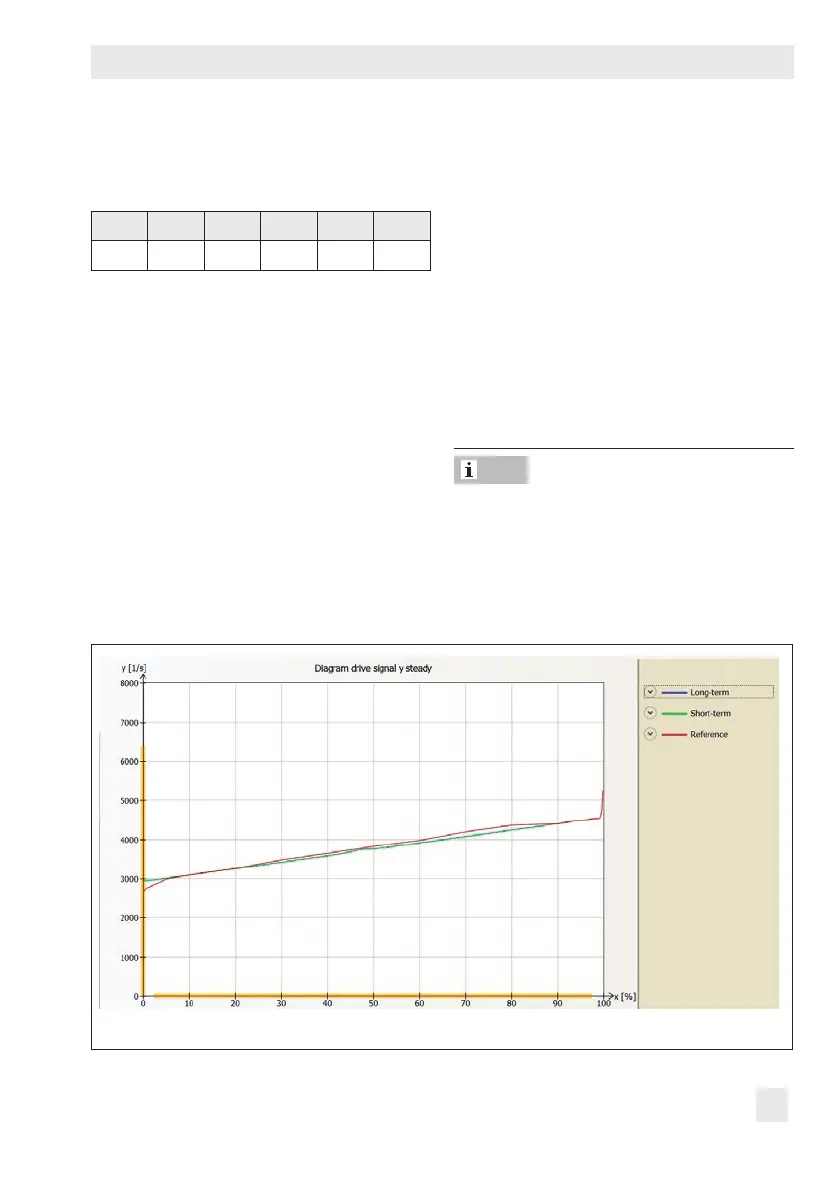
4.6 Drive signal diagram
steady-state
3730-2 3730-3 3731-3 3730-4 3730-5 3731-5
• • • • • •
The 'Drive signal diagram steady-state' re-
cords the drive signal y in relation to the
valve position x.
The drive signal y is based on the internal
control signal of the i/p converter. This sig-
nal runs directly proportional to the signal
pressure p
out
in the pneumatic actuator, in re-
lation to the valve position.
This test helps pinpoint faults in the supply
pressure, pneumatics or actuator springs.
Data are recorded in the background re-
gardless of the operating mode selected. Da-
ta logging does not need to be activated.
The positioner records the valve position x
and its associated drive signal y in closed-
loop operation after the pressure conditions
have settled (steady-state). Each pair of mea-
sured values recorded is assigned to a valve
position class. The average drive signal is
calculated for each class. The stored data
can be read out. The drive signal y is plotted
in a graph against the valve position x.
− Reference values are used in cases where
no data could be compiled for valve
positions x as the valve did not move to
those positions or a steady state could not
be reached.
Note
Fig.6: Diagnosis > Statistical information > Drive signal diagram > Steady-state
 Loading...