9
Example of In Situ Data Correction for Continuous Real-Time Mooring Data Applications
In this example, we use data collected with an SBE 43 dissolved oxygen sensor deployed in an urban marina for
4 months during the biologically active spring and summer seasons. The integrated SBE 43 and CTD (conductivity,
temperature, and depth sensor) was moored at 2 meters water depth and sampled every 10 minutes following a
30-second flush cycle. Replicate Winkler samples were collected bi-weekly from a 1.2-liter Niskin bottle adjacent to
the moored SBE 43 sensor at the time of a sample. The SBE 43 measured dissolved oxygen within 5% of Winkler
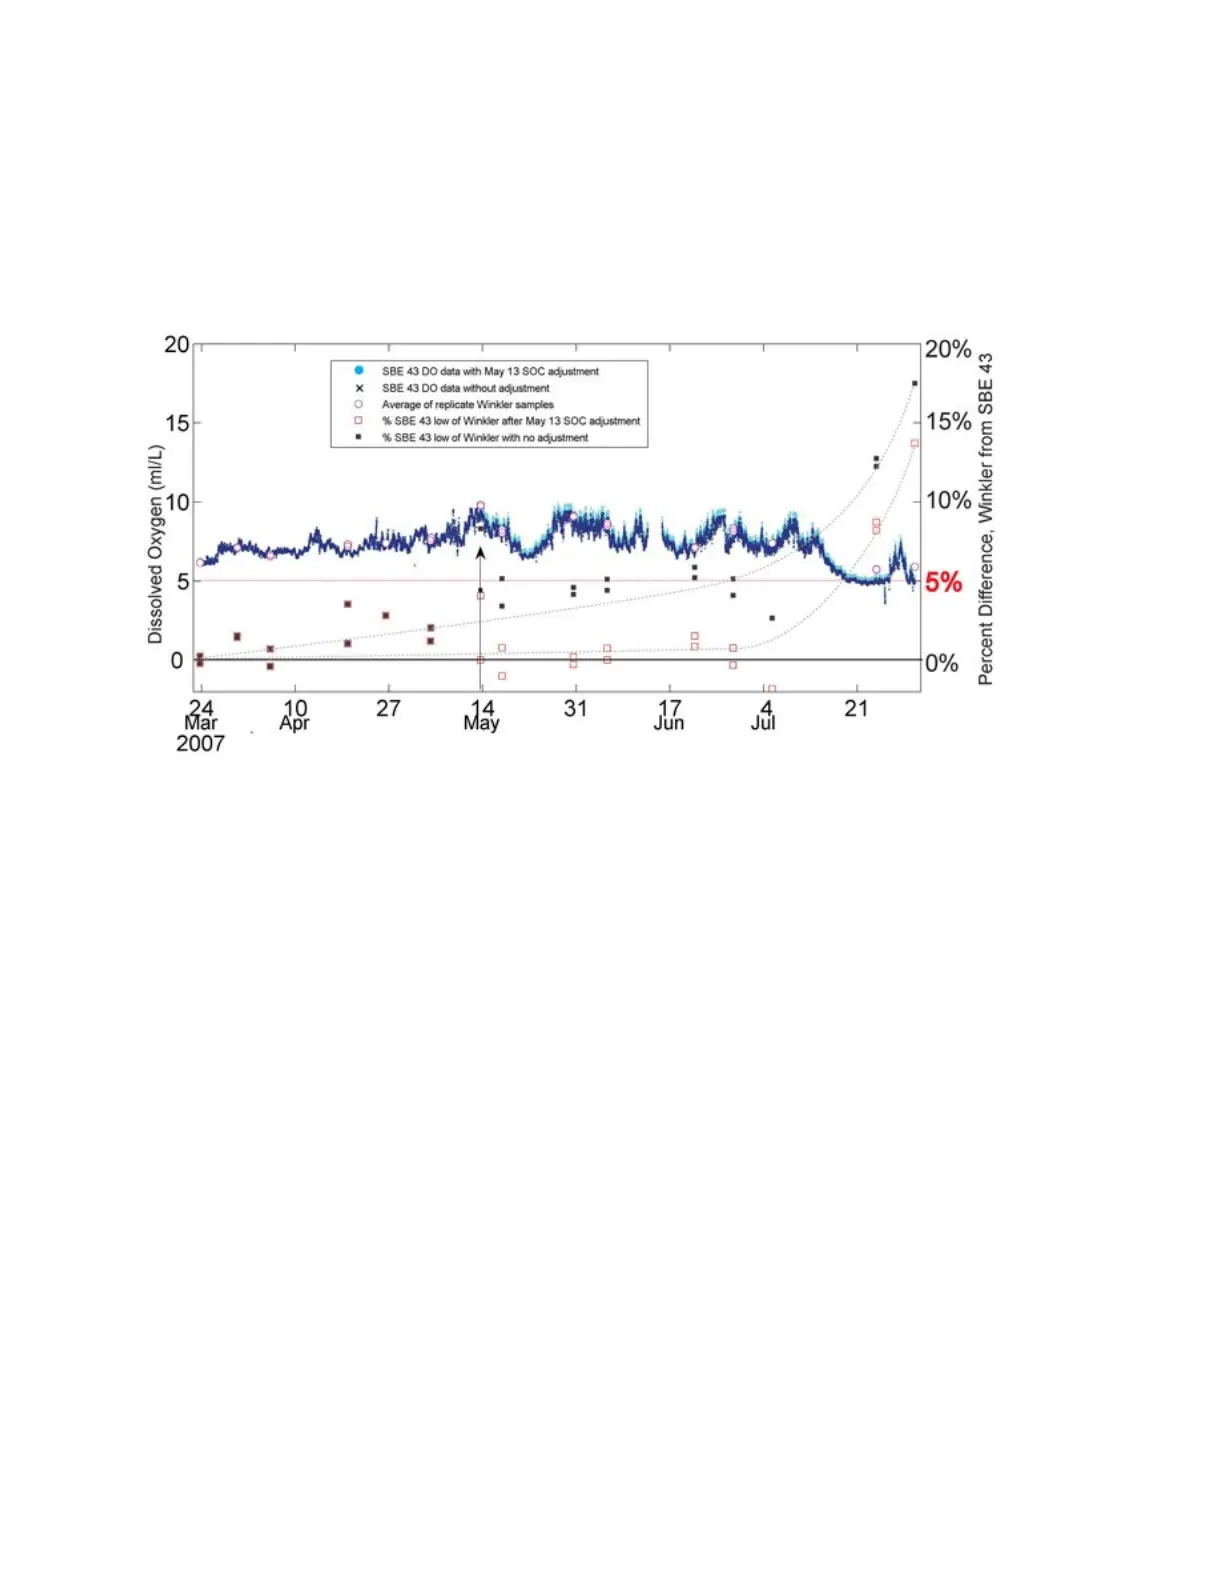
reference values for over 107 days (~3 months) during high biological fouling conditions (Figure 8).
Figure 8. SBE 43 dissolved oxygen time series plotted in dark blue, March 23 – July 31, 2007. Data with a slope
adjustment made after May 13 are co-plotted in cyan. Average Winkler values are shown as open pink circles, and
the percent difference between the SBE 43 and Winkler averages are co-plotted along the right y-axis as black solid
squares (before the May 13 validation and slope adjustment), and as red open squares (from May 13 forward
following the adjustment). The dashed curved lines are drawn to illustrate how correcting the in situ data can
prolong deployment while maintaining accuracy in real-time (or post-processed) data.
Mean standard deviation of the Winkler replicates is 0.03 ml/l.
A single validation point made on May 13 is used to demonstrate the correction of in situ sensor data without
servicing or recovering the instrument (see arrow in Figure 8). The average of the replicate Winkler values on
May 13 is 9.737 ml/l, and the SBE 43 reported 9.308 ml/l. To adjust the calibration for data after May 13, a new
SOC value is obtained by multiplying the pre-May 13 SOC value (1.3256e-04) by the ratio of the reference value to
the sensor value. Verify the units of each are compatible (ml/l, mg/l, µmol/kg, or % saturation).
[(Winkler value ml/l) / (SBE 43 value ml/l)] => (9.737/9.308 = 1.046):
NewSOC = previousSOC * ([Winkler] / [SBE 43])
1.3866e-04 = 1.3256e-04 *1.046
The result of using the NewSOC on data collected after May 13 demonstrates how sensor accuracy is maintained
near initial calibration accuracy by using a single quality reference sample (Figure 8). See the next example for a
description of how to apply a correction to data preceding the May 13 reference sample.
Note: We recommend that the sensor be returned to the factory for servicing when the NewSOC value represents a
change of 15 - 20% from the original calibration and cannot be restored with standard cleaning protocols
(see Application Note 64 for cleaning recommendations).
244