Maintenance and Troubleshooting ST94-21 C/Ku-Band TVRO
• The Level tilt display should plot on the red reference line when the level cage is level, referenced to
the horizon. It should decrease (plots below red line) when the antenna is tilted forward (EL down)
and increase (plots above red line) when tilted back (EL up).
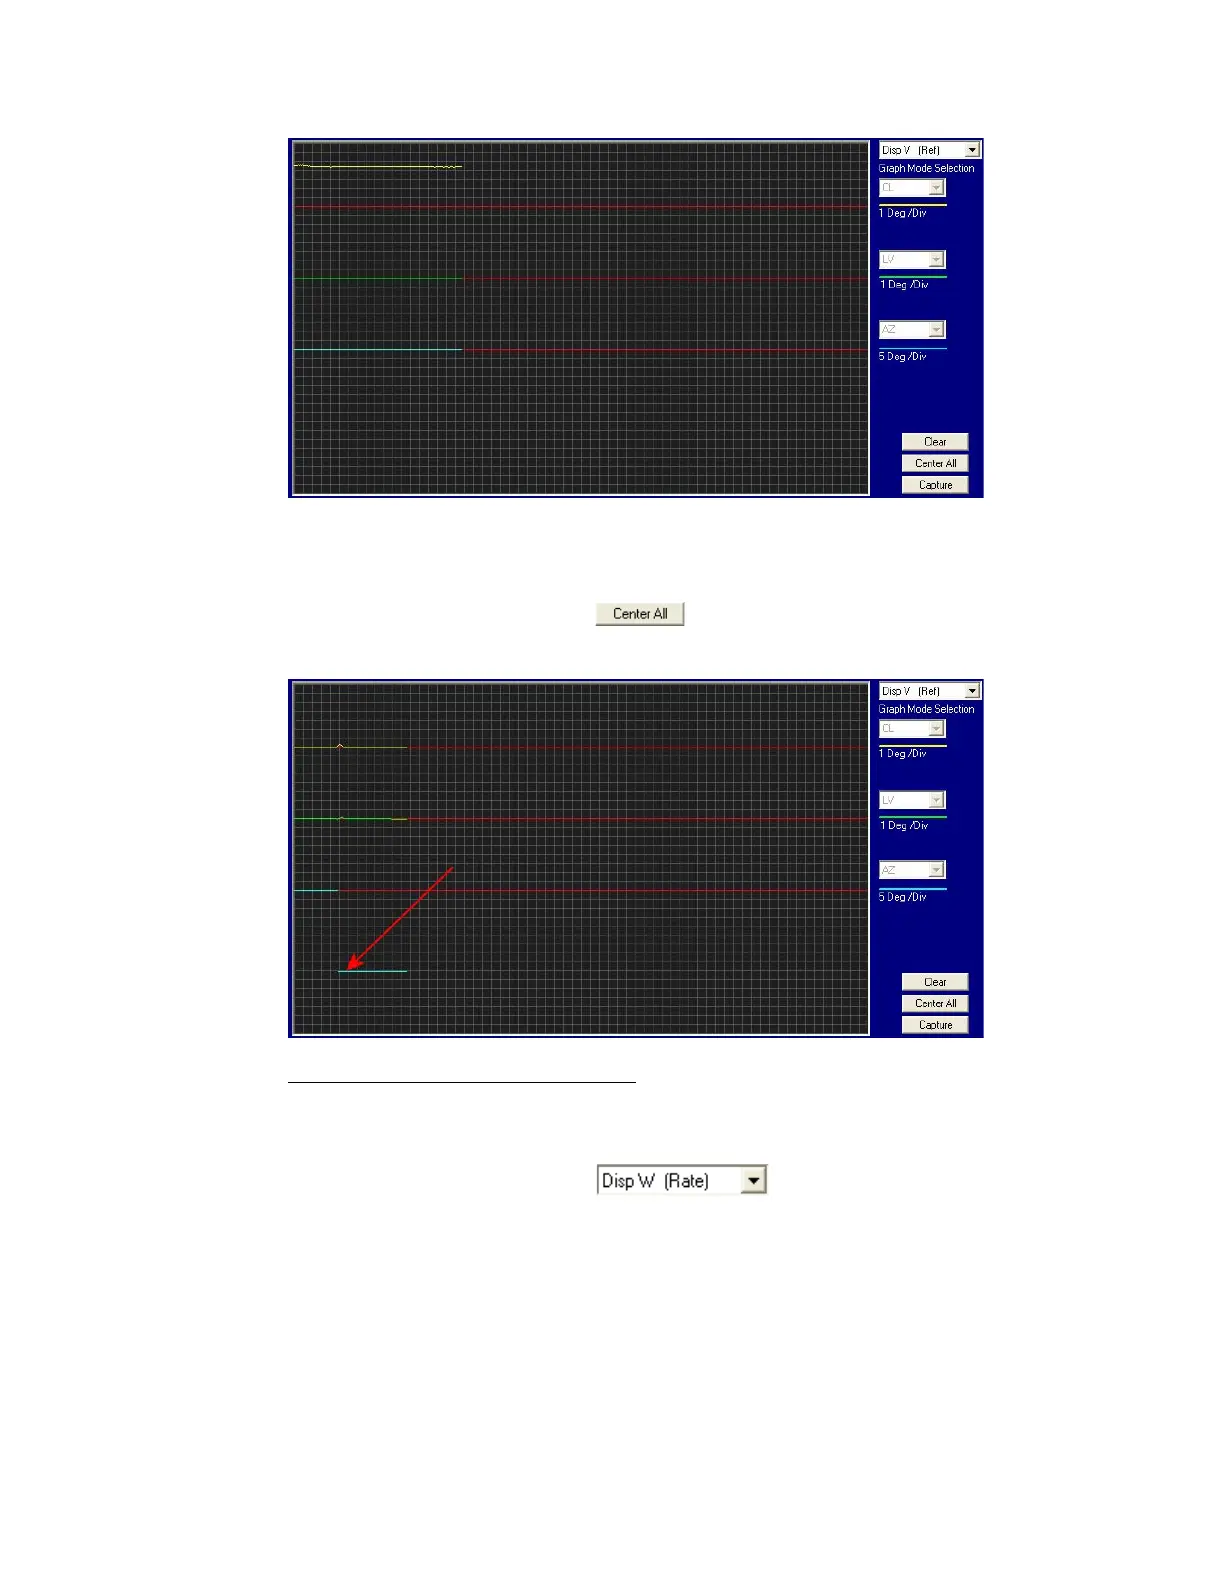
• The Azimuth display for the Home Switch will normally display a logic level high (plots directly on
Red reference line after clicking on the button) when the home flag is NOT engaged and
changing to a logic level low when engaged. See below for a screen capture of an antenna that was
driven so that the Home Flag switch is engaged.
13.7.7. Open Loop Rate Sensor Monitoring
The DacRemP DISPW graph chart provides a means for monitoring the output of the 3 solid state rate
sensors (located inside the Level Cage Assembly) for diagnostic purposes. The rate sensors are the primary
inputs to the PCU for stabilization.
• To monitor the rate sensors, select the graph chart
• This chart displays sensed output from the 3 rate sensors via three traces, CL (Cross Level), LV
(Elevation), and AZ (Azimuth), at a fixed 1º/Second/vertical division.
• A normal trace display will be ± 1 divisions from the red reference line. The example shown below
shows an antenna that is NOT currently sensing motion in any axis.
EAR Controlled - ECCN EAR99