Copyright © Sigicom AB 2019
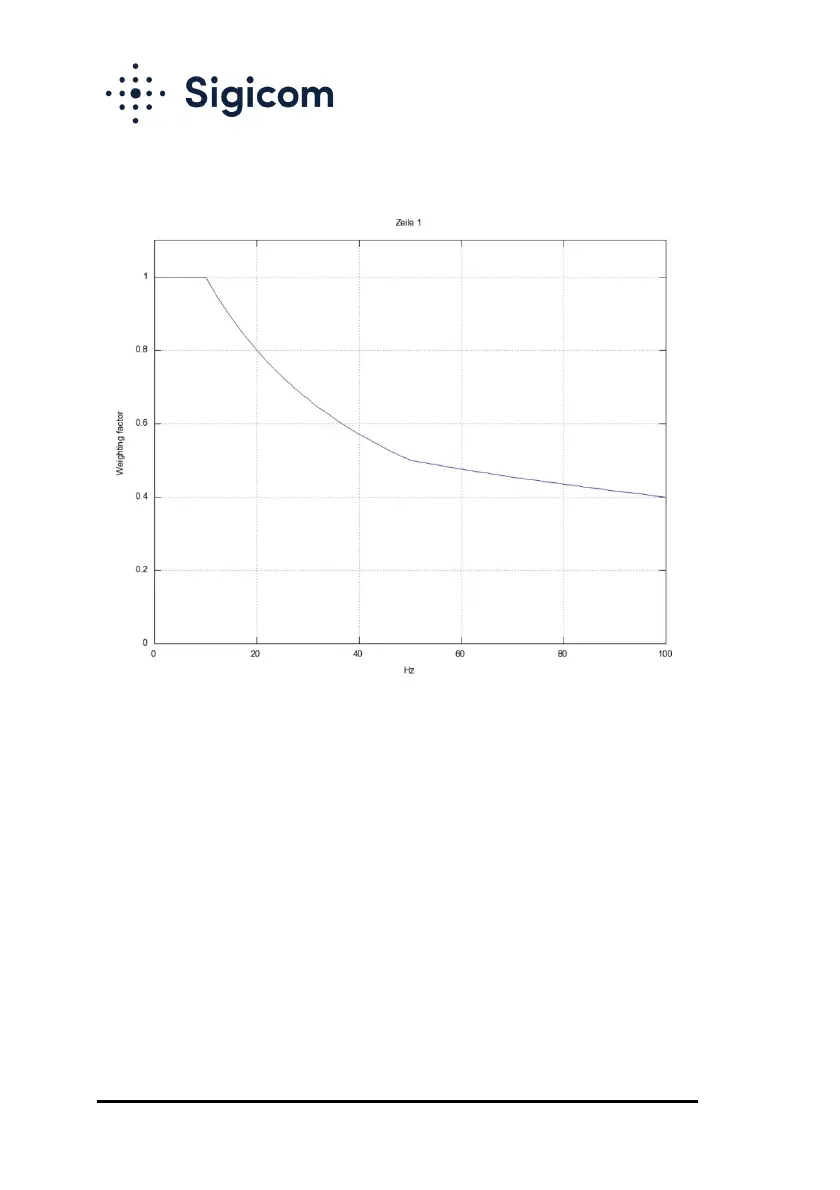
The limits in figure I1 lead to the weighting curves in figures I2 – I4,
which are implemented in the firmware of INFRA C12.
Figure I2. The weighting of the measured signal, made by the
C12 firmware when configured with standard DIN 4150-3, Zeile 1.
So, in this example, a maximum vibration level detected as
• 35 mm/s
• 50.0 Hz
will be used as
• 17.5 mm/s
• 50.0 Hz
These two points are illustrated with the red stars in Figure I1.
Note! This means that a trigger event will not occur in this
example, although 35 mm/s is measured and threshold level = 20
mm/s.
 Loading...