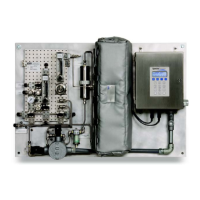
Serial Port Communications
401-92-4 A .ver 97020-00094
–5
3. Once capturing is in place, enter Mode 6 by pressing # key followed
by the 6 key.
The index shown on the LCD display counts by 50’s from 0 to 511 in
a few seconds and the screen displays:
4. Press the # key followed by the 1 key to return to Mode 1.
5. Once normal operation resumes, wait approximately three minutes
then stop the capture of the serial data. To stop the capture of the
serial data, click on Transfer/Capture Text/Stop. The resulting
data files contain the downloaded data as shown in Figure 4–5.
You c
an import th
e stored data file into a spreadsheet program such as
Microsoft Excel
®
to plot the data (see "Viewing Diagnostic Data with
Microsoft Excel" for more information.
Viewing Diagnostic Data with Microsoft Excel
A spreadsheet program such as Microsoft Excel can import the data collected
in the Mode 6 data dump for viewing and plotting.
To import the data file into Excel:
1. In Excel, click Open and choose the name of the spectrum file saved
while in Mode 6. Be sure to select All Files (*.*) under Files of
type: while searching, as shown in Figure 4–7a.
2. T
he Text Import Wizard should open. Choose the Delimited
option and click Next, as shown in Figure 4–7b.
3. Under Delimiters, choose the Tab and Space options, check the
Treat Consecutive Delimiters as One box, as shown in Figure
4–8a, and then click Finish to display the spreadsheet. The first few
+
# 6
Dump Stats Mode...
Index: 0
Mode
UK Distibution by IMA Ltd Tel: +44 (0)1943 878877 Email: info@ima.co.uk Web: www.ima.co.uk
 Loading...