50
742.221 | 12.04
EN
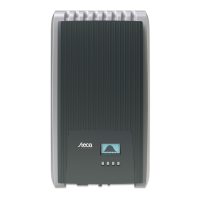
Graphical yield (day, month, year)
Daily, monthly and annual yields can be displayed graphically in a Chart.
2
2
3
1
4
Period for a single yield value (here: daily yield)
y-axis:
– Yield in kWh
– With an extra M: yield in MWh
– The scaling changes depending on the maximum value
x-axis: time in hours/days/months/years
Total of all individual yields shown in the diagram, in kWh
The graphical representation can show annual yields for the
last 20 years.
Event messages
See Section 11, p. 72.
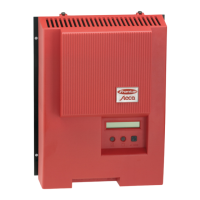
Generator characteristic curve
1
2 3
X-axis: Input voltage in V
Y-axis: Power in kW
Peak = MPP
When the Gener. Ch. Curve menu item is called the inverter
records the generator characteristic curve of the module and
then displays it (Fig. upper left). The following applies:
• The inverter traverses the entire input voltage range and
records the power generated over this range. Duration: a
few seconds, is displayed.
• The MPP is the peak of the generator characteristic curve.
• This peak and the generator characteristic curve change
with the level of solar irradiation.
• Multiple peaks are a sign of partial shadowing (Fig. lower
left).
• If the top of the curve is flat then the inverter can possibly
no longer feed power into the grid.
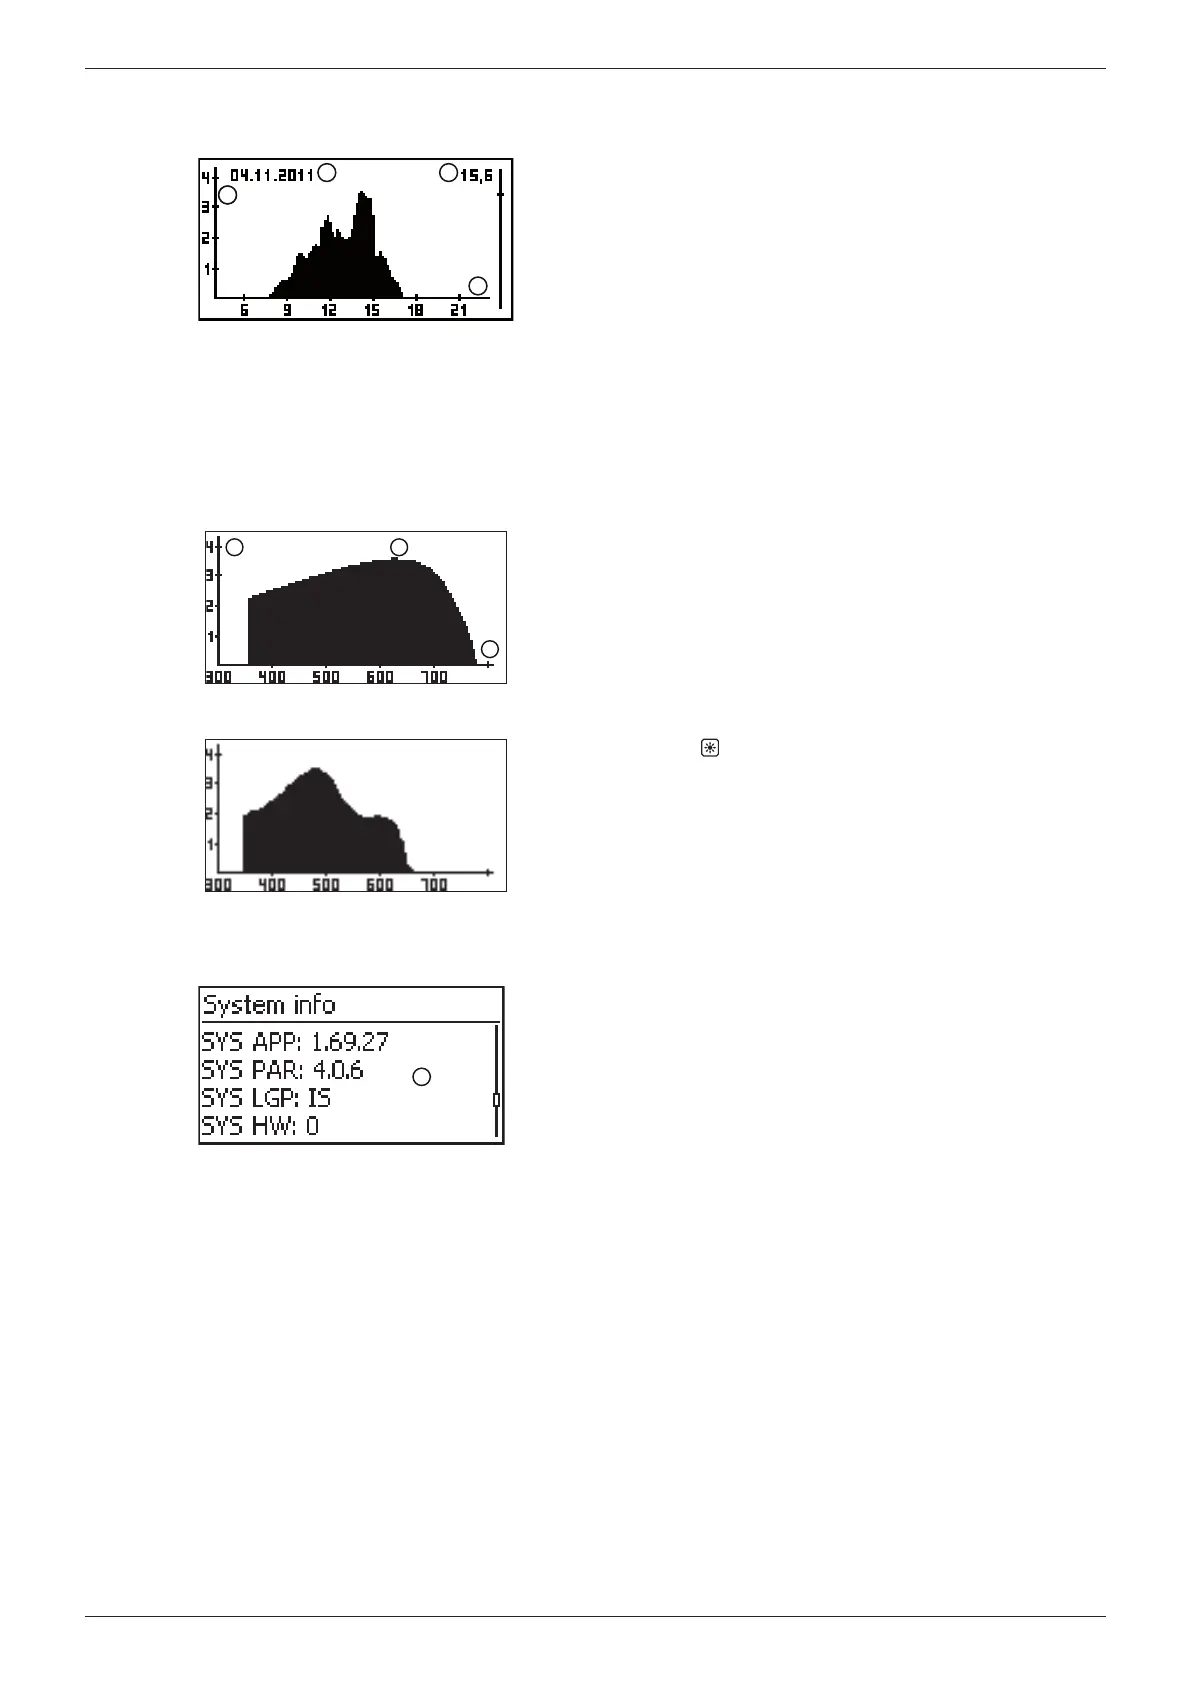
Information
1
The Information menu item contains the following sub-
menu items.
• Contact info
• System info (see fig. left):
– Product designation
– Serial number of the inverter
– Information on the software and hardware versions of
the inverter (see example in fig. left)
– Country setting (country currently set)
– Inverter address
– Version of the operating instructions for the inverter
• Country setting: country that is currently set and
country-specific grid parameters; see also p. 77.
• React. pwr. char. curve: Reactive power characteristic
curve graph (only when prescribed for currently set coun-
try)
• Self test: Result of the last successfully performed self
test (only when the configured country is Italy)