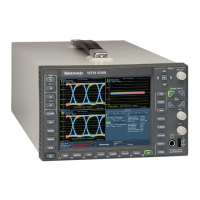
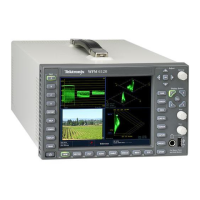
Monitoring the SDI Physical Layer
To Make Eye Measurements
After you have configured the instrument for Eye measurements, you can have
the instrument perform automatic eye measurements (Option PHY only) or you
can use the cursors to perform manual waveform measurements. The following
procedures explain how to conduct both measurement types.
NOTE. If you
have Option PHY and you use the measurement cursors to manually
measure the eye waveform, you might get a different result than that shown
in the automatic eye measurements readout. This is because the automatic
amplitude measurement uses histograms to be minimally affected by overshoot,
ringing, and noise on the signal. Similarly, the automatic rise time and fall time
measurements use histograms to find the centers of the distributions of 20% and
80% cross
ings. The difference between manual and automatic measurements is
usually insignificant for clean, symmetrical signals.
Eye Measurement Set Up
1. Configu
re your instrument to monitor the SDI physical layer. (See page 102.)
2. Connect a serial video-signal to your instrument using a 75 Ω cable of two
meter
s or less in length. Use high-quality, low-loss coaxial cable, such as
Belden8281.
3. Select a tile and press the EYE button.
4. Press the GAIN button to display the gain menu, select VA R G a i n ,andturn
the GENERAL knob until the vertical gain is x1.00.
To Make Manual E ye
Measurements
NOTE. Use the SWEEP button to change the sweep of the Eye display.
1. Pe
rform the initial setup for Eye measurements. (See page 105, Eye
Measurement Set Up.)
2
.
P
ress the CURSOR button to display the measurement cursors.
3
.
P
osition one voltage cursor at the top part of the waveform, ignoring any
overshoot or undershoot on the rising or falling edges. (See Figure 52.)
4. Position one voltage cursor at the bottom part of the waveform, ignoring any
overshoot or undershoot on the rising or falling edges. (See Figure 52.)
5. Note the amplitude of the eye waveform that is displayed in the Voltage
Cursor readout. (See Figure 52.)
WFM8200 and WFM8300 Waveform Monitors 105
 Loading...