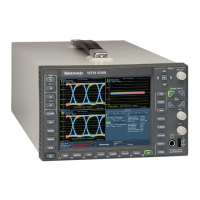
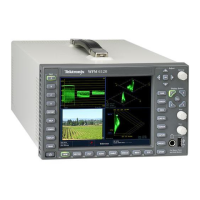
Display Information
SDI Status
View two measur
ements of signal jitter and cable loss in both dB a nd meters of
the selected cable type, and calculated source level. With Option PHY, automatic
measurements of eye amplitude, rise time, fall time, overshoot, and rise-fall
difference are also displayed. (See Figure 44.) (See page 101, Monitoring the
SDI Physic al Layer.)
Figure 44: SDI Status display
Elements of the SDI Status display. Some elements are option dependent.
Jitter and Cable Loss Thermometers: The horizontal bar graphs show
your measured values. 0 -70% of the of the threshold value is represented
by a gr
een area; 70-100% by a yellow area; 100-170% by a red area. The
measured value is shown as a black diamond.
Jitt
er1 HP Filter: Sets the jitter high pass filter for one of the two jitter
engines that drive the EYE display. Selectable as: Timing (set to 1 0Hz);
Align (auto set to default filter settings); 10Hz; 1kHz; 10kHz; 100kHz. Jitter1
settings appear in tile 1 a nd 2.
P-P: Shows the peak-to-peak jitter measurement, in time units and UIs (unit
intervals).
Jitter2 HP Filter: Sets the jitter high pass filter for the second of the two jitter
engines that drive the EYE display. Settings are the same as for Jitter1, above.
Jitter2 settings appear in tile 3 a nd 4.
Cable Loss: Shows the signal loss in dB, at the frequency specified in the
Cable Loss field of the Physical Layer Settings selection available from the
CONFIG button.
Approx Cable: Shows the approximate length of cable, assuming a
continuous run of cable of the specified type, as specified in the Cable Type
field of the Physical Layer Settings selection available from the CONFIG
button.
78 WFM8200 and WFM8300 Waveform Monitors
 Loading...