Figure 2-5. Importing the register configuration file status
2.2 Capturing the AFE data and Plotting
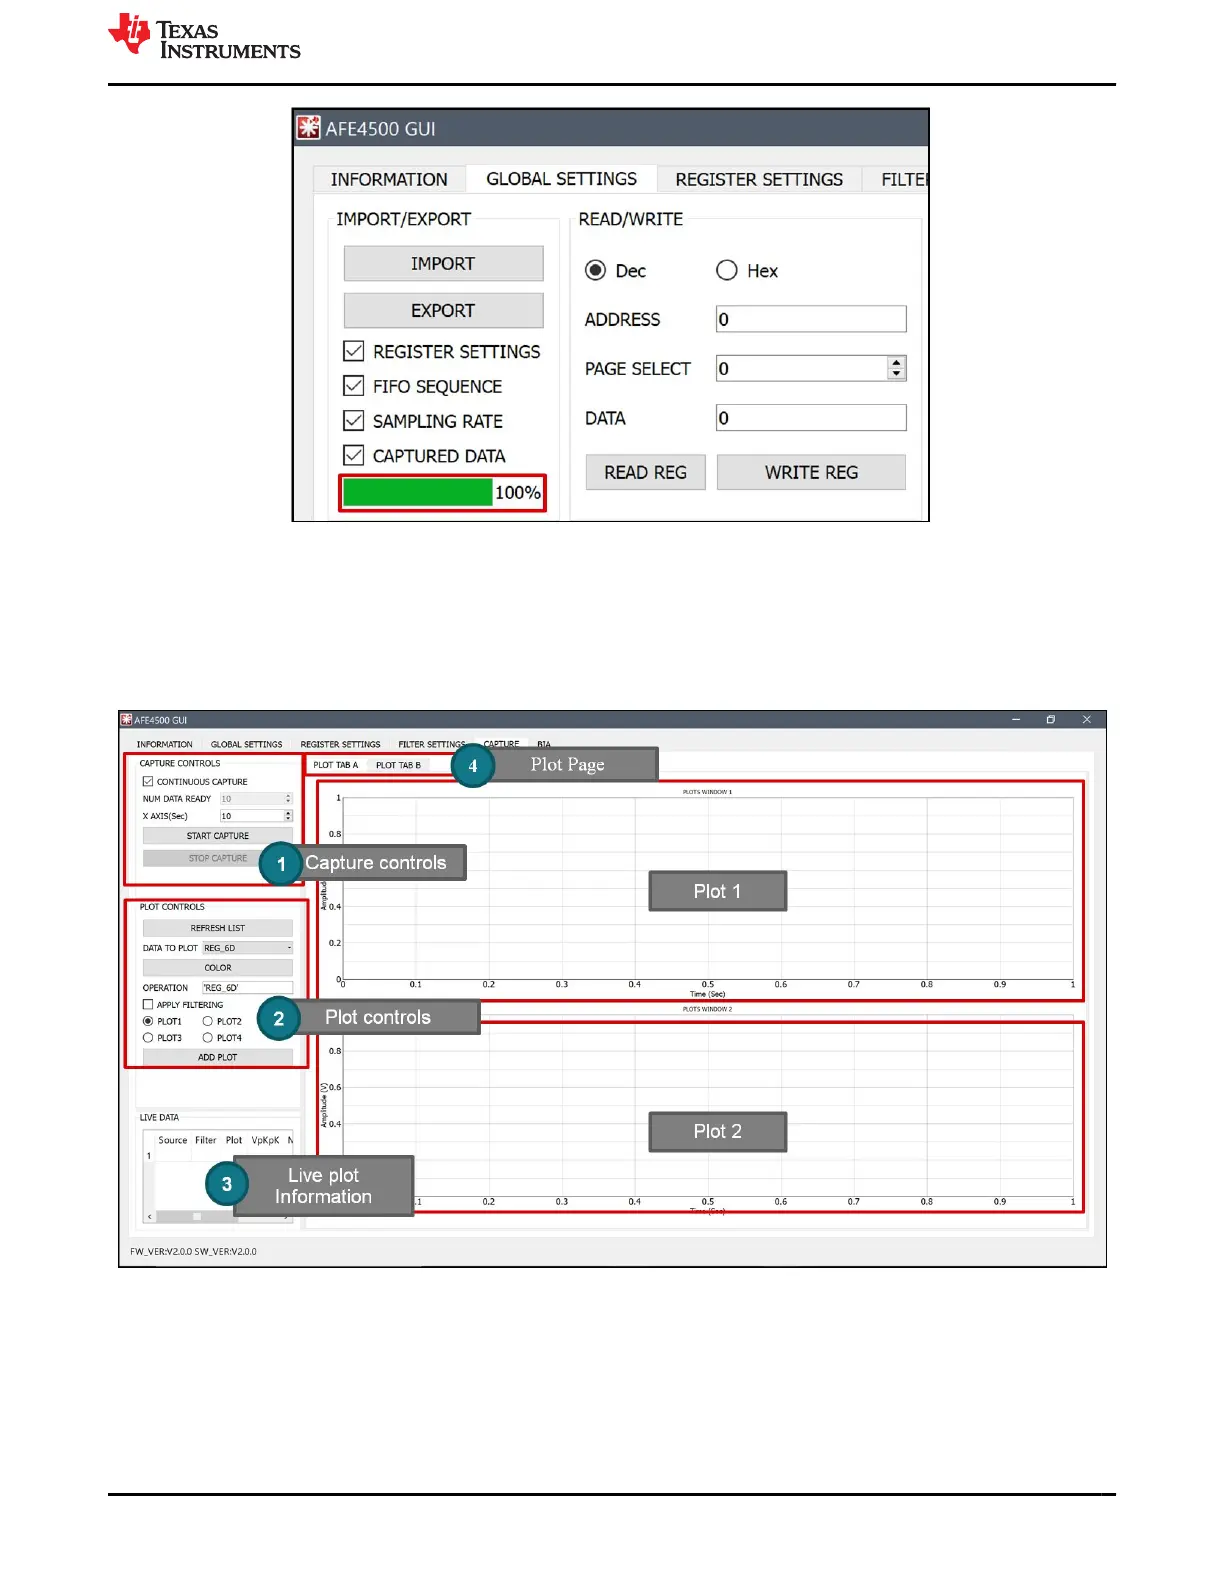
The capture page window is shown in Figure 2-6. It has various controls listed below
1. Capture Controls: Configure the capture settings here. Capture can be either made continuous or only for
limited number of FIFO_RDY interrupts. The plot x-axis time to be displayed can also be adjusted here
Figure 2-6. Capture page of EVM GUI
2. Plot Controls: Configure the data to be plotted. Follow the steps below, see Figure 2-6
• Click on the Refresh List.
• The Data to Plot drop down will list all the different signals that can be visualized in the plots.
• When a signal is selected, it appears in Operation tab. The signal name is in single quotes.
• Check “APPLY FILTERING” if signal needs to be filtered using software filters.
• Select the Plot1, Plot2, Plot3 or Plot4 in which the signal is to be plotted. Click Add Plot.
www.ti.com
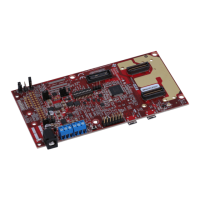
EVM Software
SBAU370 – APRIL 2021
Submit Document Feedback
AFE4500 EVM User Guide 11
Copyright © 2021 Texas Instruments Incorporated