• Mathematical operations between signals can also be performed in the Operation tab and the result of it
can be plotted. For example two PPG signals TIA1-1 and TIA1-2 can be subtracted with ‘TIA1-1’-‘TIA1-2’.
All the data are floating numbers.
• To remove a signal from a plot, simply double click on the signal source name in the Live Data tab.
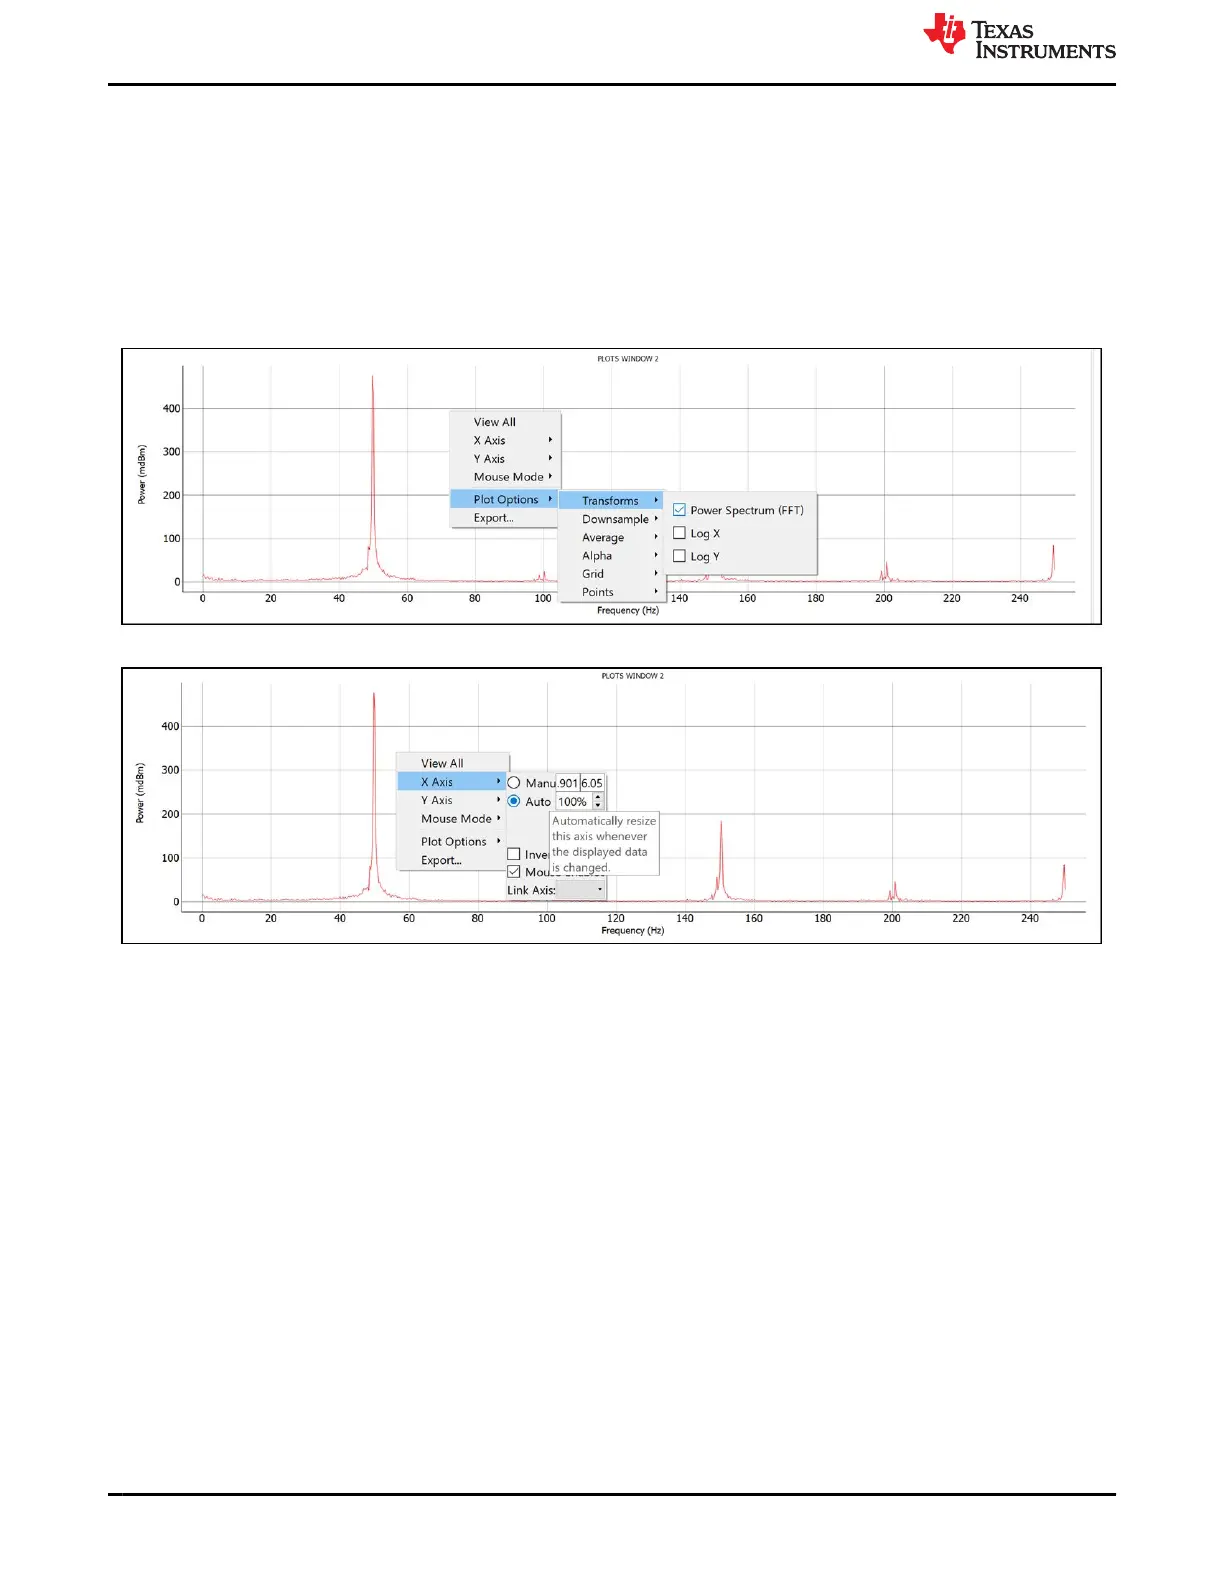
3. Plot Window: Displays the live data for all the signals added to the respective plots using “Plot Controls”. By
default the time domain data is displayed in each plot, however frequency spectrum of signals can be plotted
by right clicking a plot and selecting “Plot Options >> Transforms >> Power Spectrum (FFT)”. To change
the plot from frequency domain to time domain, simply uncheck the “Power Spectrum (FFT)”. Adding a new
plot, changes all the plots to time domain. Right click on plots also gives options regarding axis such as auto
scale. Auto scale shortcut is ‘A’.
Figure 2-7. Controls available within the plot
4. Data Filtering: There are two digital filters implemented in the GUI, one is Low Pass Filter (LPF) and other
is Notch Filter. By default both the filter are disabled and can be enabled in “FILTER SETTINGS” tab of
the GUI. Once enabled, all the plots which has “APPLY FILTERING” checked during plot configuration, are
filtered and plotted in their respective plot window. Characteristics of each filter such as filter order and cutoff
frequency can be tweaked in “FILTER SETTINGS” tab. Each filer can be individually enabled or disabled.
EVM Software
www.ti.com
12 AFE4500 EVM User Guide SBAU370 – APRIL 2021
Submit Document Feedback
Copyright © 2021 Texas Instruments Incorporated