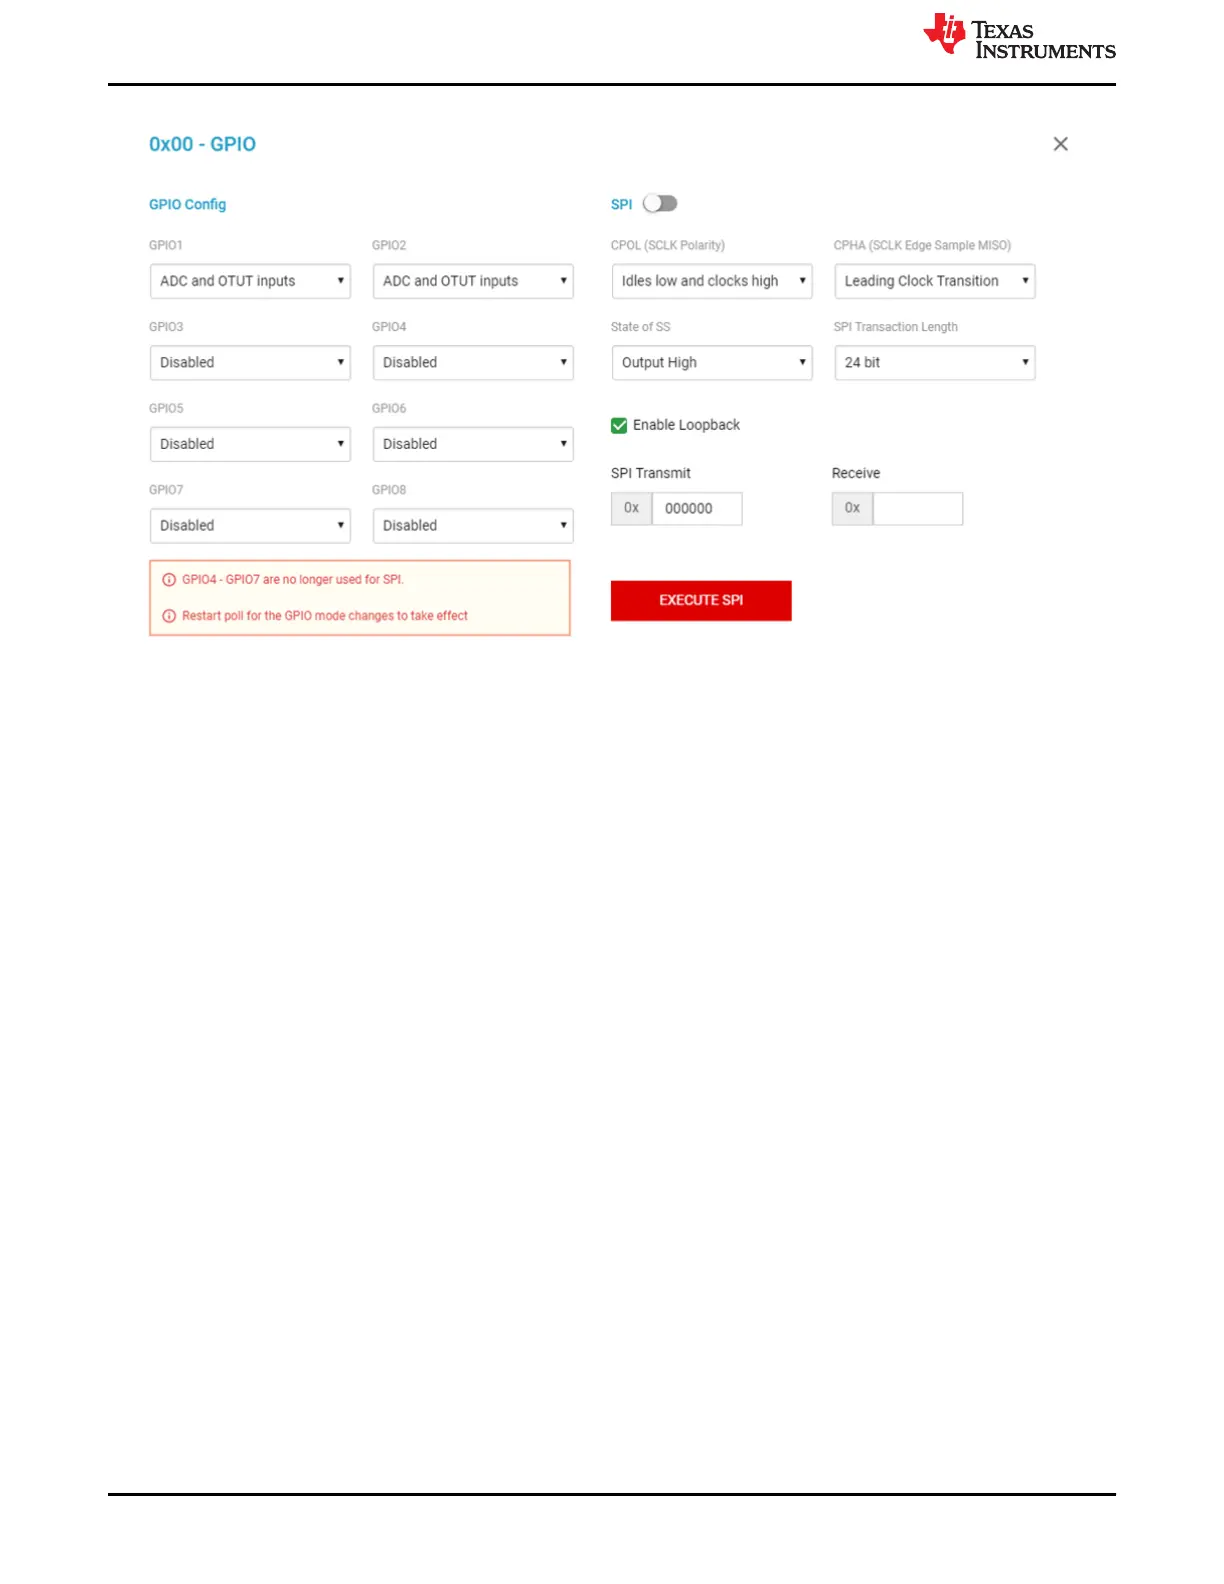
Figure 3-5. GPIO Config Pop Up Window
3.4 Detailed Device View
The user can navigate to a detailed device view by clicking on any of the underlined device addresses. At the
top of the page, a grid representation of cell voltages and cell balancing status allows the user evaluate cell
status at a glance. The right-hand side of the page houses a collapsible board details pane where the status bits
of each board and fault summary are displayed. Clicking on any of the individual cells in the grid displays its
OVUV fault status in the bottom right-hand corner.
On the bottom of the page is a time domain cell voltage plot. While polling is running, the plot updates itself with
the new data points. The user can select which cell waveforms to display by clicking on the "+" button. There are
several buttons in the upper right-hand corner of the plot area to interact with the plot. The user has multiple
zoom options, can display numerical data within the plot area, and can save an image of the plot. You can also
export this data vs. time to a .csv file by clicking the red export button at the top right of the plotting window. Note
that the user must be polling to export any data over time.
Cell Monitor
www.ti.com
16 BQ79616-Q1 and BQ75614-Q1 GUI User's Guide SLUUC36 – DECEMBER 2020
Submit Document Feedback
Copyright © 2020 Texas Instruments Incorporated
 Loading...