Hardware
www.ti.com
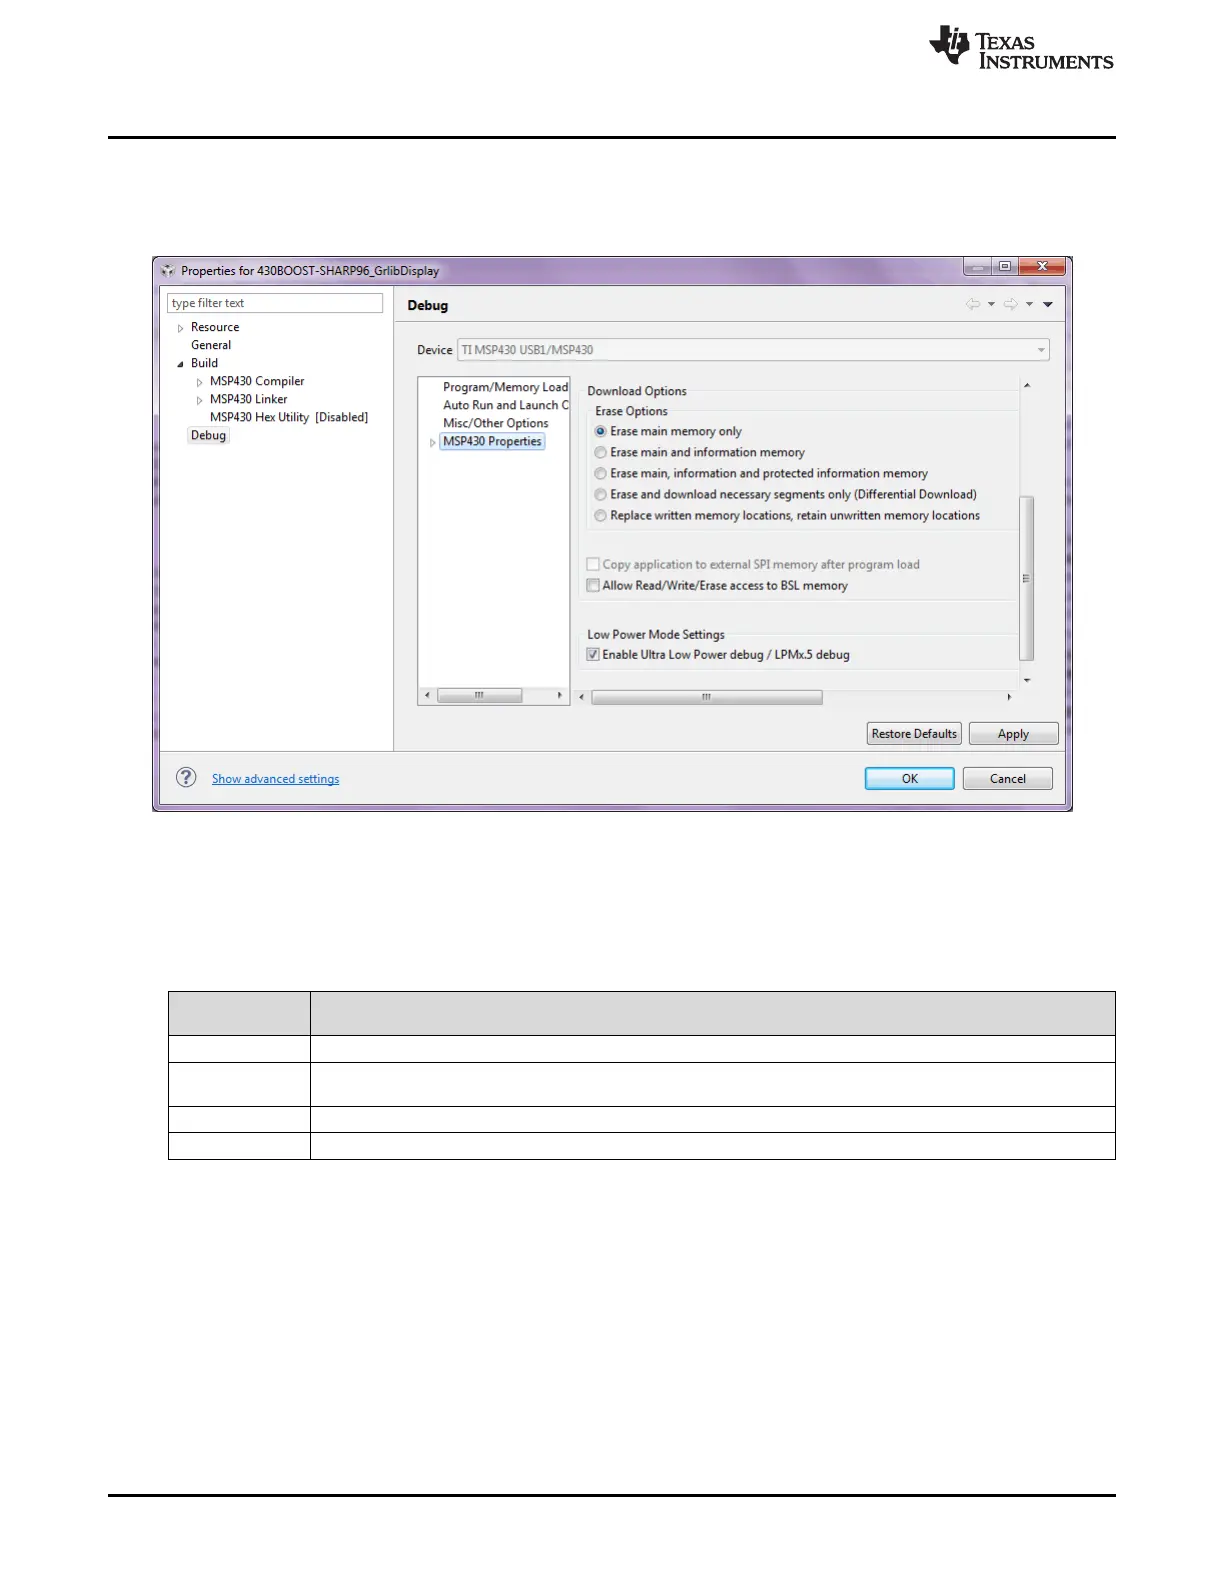
To fully enable the EnergyTrace++ setting, the ultra-low-power debug mode must be enabled. Right click
on the active project in the project explorer and click Properties. In the Debug section, enable "Ultra Low
Power debug/ Debug LPMx.5" option in the Low Power Mode Settings (see Figure 8). If this option is not
enabled, the EnergyTrace++ mode cannot capture data from the device.
Figure 8. Debug Properties
After the correct settings are chosen, the EnergyTrace window automatically opens when debug is started.
The EnergyTrace++ window has four separate tabs: Profile, States, Power, and Energy.
Table 1. EnergyTrace++ Debug Windows
EnergyTrace++ Description
Debug Window
Profile Displays a compressed view of captured data and allows comparison with previous data
States Real-time trace of the target microcontroller's internal states captured. Includes power modes and peripheral
on/off states.
Power Dynamic power consumption of the target over time. A previous trace profile for comparison is yellow in color.
Energy Accumulated energy of the target over time. A previous trace profile for comparison is yellow in color.
12
MSP430FR5969 LaunchPad™ Development Kit (MSP
‑
EXP430FR5969) SLAU535B–February 2014–Revised July 2015
Submit Documentation Feedback
Copyright © 2014–2015, Texas Instruments Incorporated
 Loading...