Parametric Graphing 5-5
When you press
,
, the TI
-
80 plots the selected
parametric equations. It evaluates both the
X
and the
Y
component for each value of
T
(from
TMIN
to
TMAX
in
intervals of
TSTEP
) and then plots each point defined by
X
and
Y
. The Window
variables define the viewing window.
As a graph is plotted, the TI
-
80 updates
X
,
Y
, and
T
.
Note: Smart Graph applies to parametric graphs also (page
4
-
11).
By means of the
VARS WINDOW...
and
Y-VARS
menus, you
can:
¦
Access functions by using the name of the component of
the equation as a variable.
¦
Select or deselect parametric equations from a program,
using the
FNON
and
FNOFF
commands (page 4
-
8).
¦
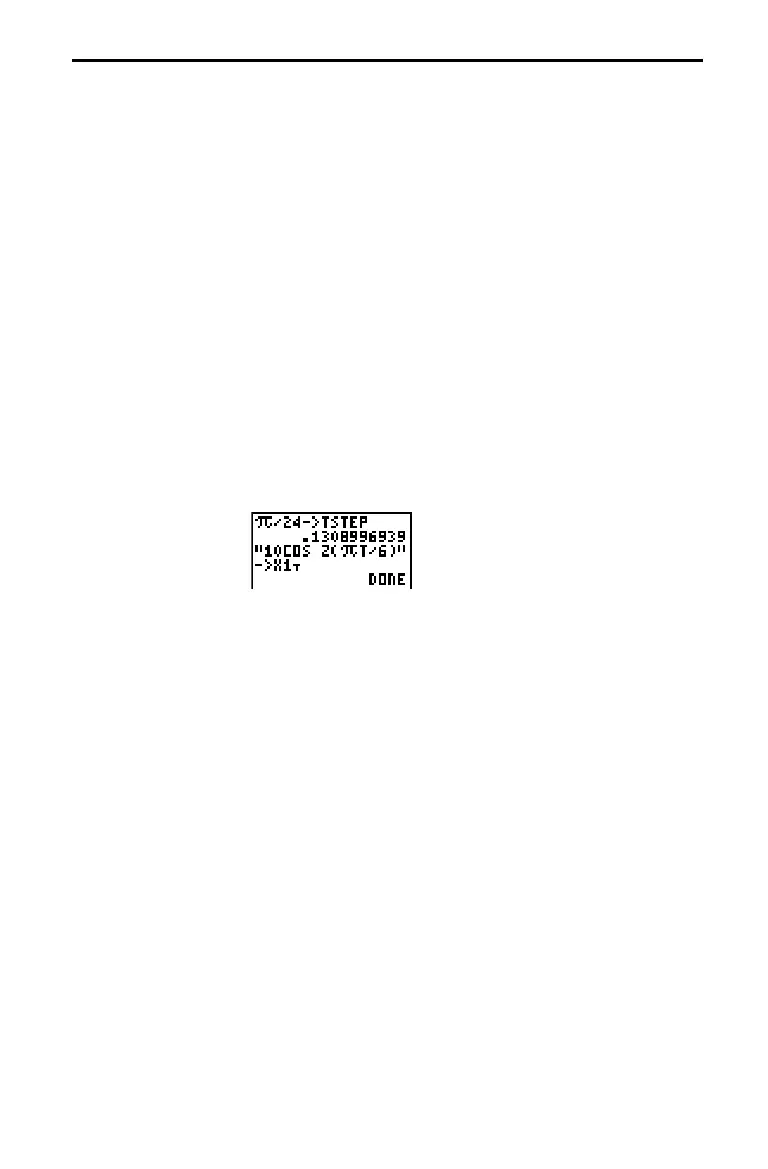
Store parametric equations.
¦
Store values directly to Window variables.
Displaying a
Graph
VARS WINDOW
and Y-VARS
Menus