Test Procedures
Page 32 of 60 M1393R0 OQ/PQ Operating Instructions
4.7.1 Performing the UV Detector Linearity Test
Depending on the system configuration, the ‘UV Detector linearity_NAN’ or ‘UV Detector
linearity_CAP’ sequence is used to perform the detector linearity test. The detector
linearity is determined at 272 nm using caffeine standard samples with different
concentrations:
• CAP configuration: 0.25, 0.5, 1.0, 2.0, 5.0, 10.0 and 20.0 µg/mL
• NAN configuration: 1.0, 2.0, 5.0, 10.0 , 20.0, 40.0 and 60.0 µg/mL
Install the samples in their proper positions in the FAMOS autosampler rack (TABLE 3-5).
TABLE 2-1 presents the conditions for the linearity test for the two different system
configurations.
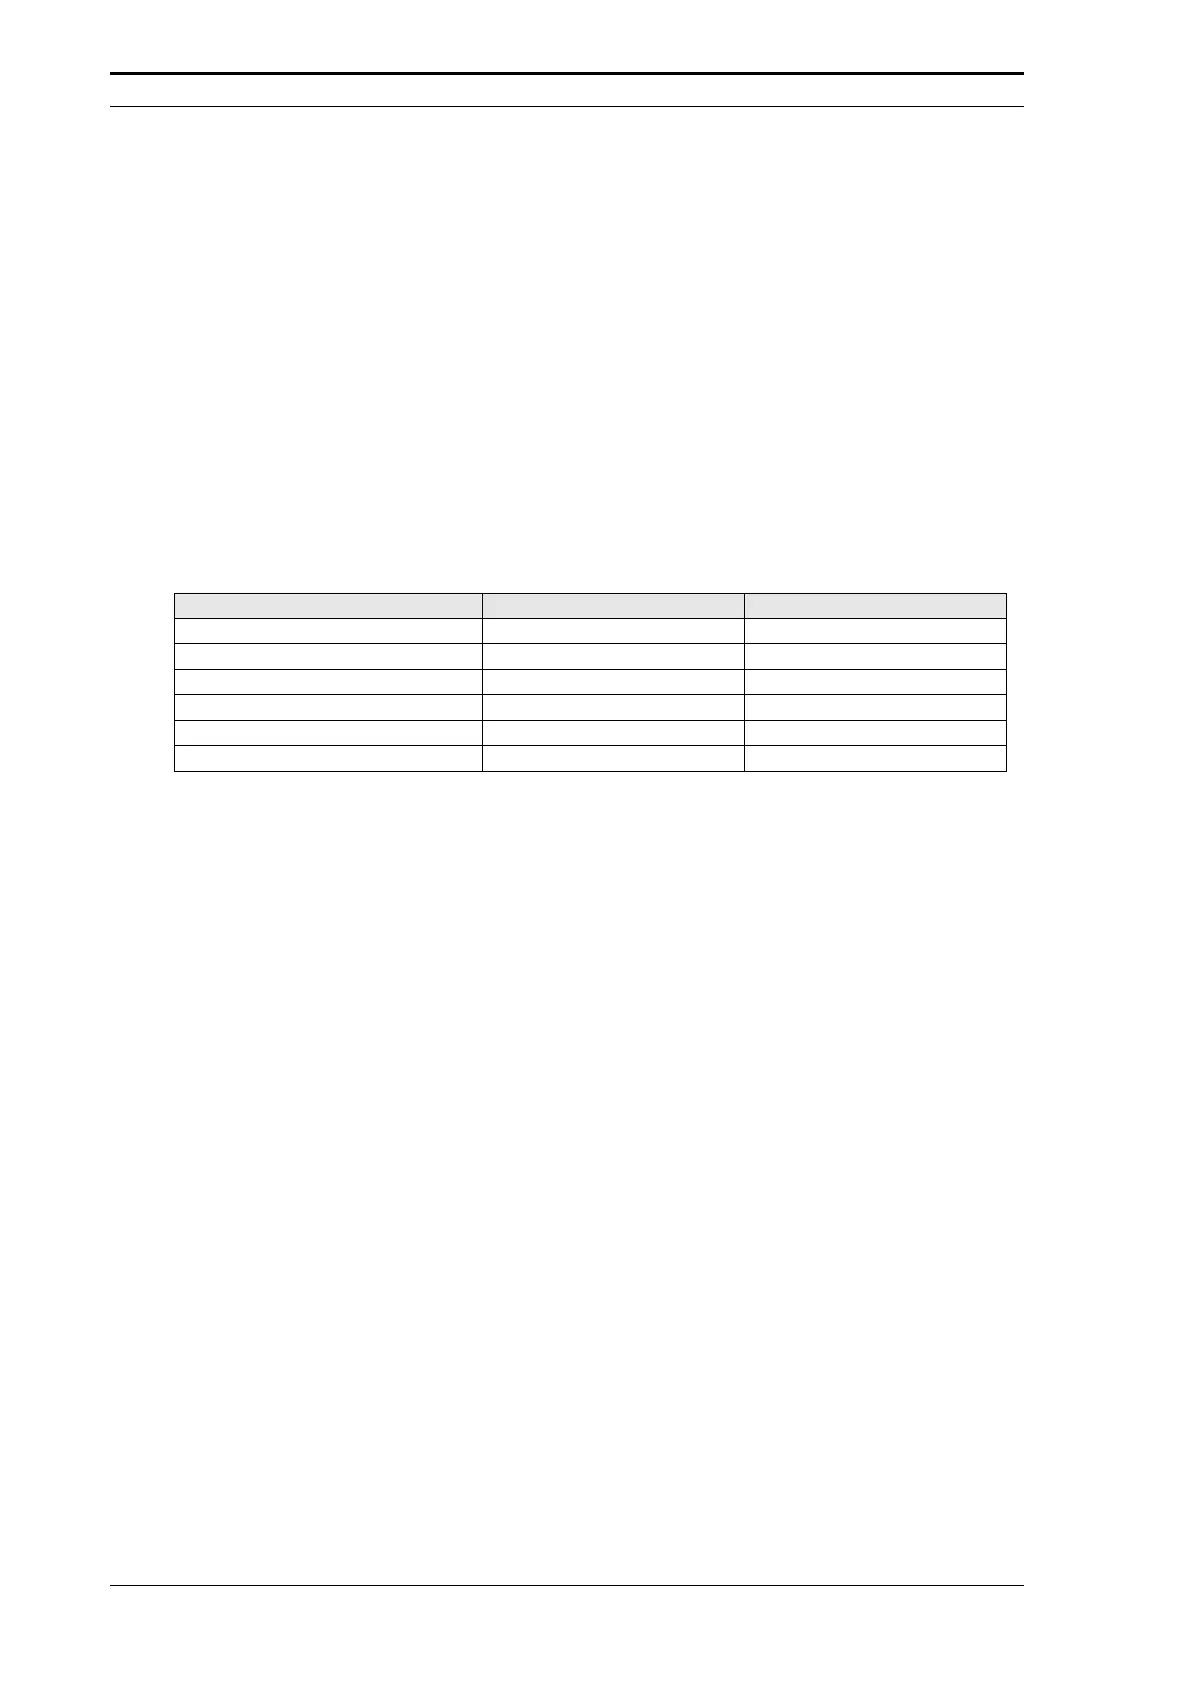
TABLE 4-1 Experimental Conditions – UV Detector Linearity
Parameter Nano Configuration Capillary Configuration
Detection wavelength 272 nm 272 nm
Run time 8 min 4 min
Flow rate
0.4 µL/min 4.0 µL/min
CRP 625 50
Injection loop
1.0 µL 1.0 µL
Injection type Partial Loop Fill, 0.2 µL Partial Loop Fill, 0.5 µL
To perform the UV Detector linearity test:
a) Setup the UltiMate system and the FAMOS Microautosampler as discussed in Sections
3.2.2 A and 3.2.2 B.
b) Start the flow delivery of the UltiMate Micropump from the CHROMELEON control panel.
c) After equilibration, start the sequence ‘XQ_3_UV_Linearity_NAN’ (or ‘_CAP’,
respectively).
To evaluate the result of the ‘UV Detector linearity Test’:
a) Use the quantization file ‘caffeine.qnt’.
b) Check the integration and correct if necessary.
c) Verify that the correlation coefficient meets the acceptance criteria (TABLE 2-3).