Test Procedures
Page 34 of 60 M1393R0 OQ/PQ Operating Instructions
4.9 Linearity of the injection
The injection linearity is measured by injecting different amounts of the same caffeine
standard. The resulting peak area is used for the calculations.
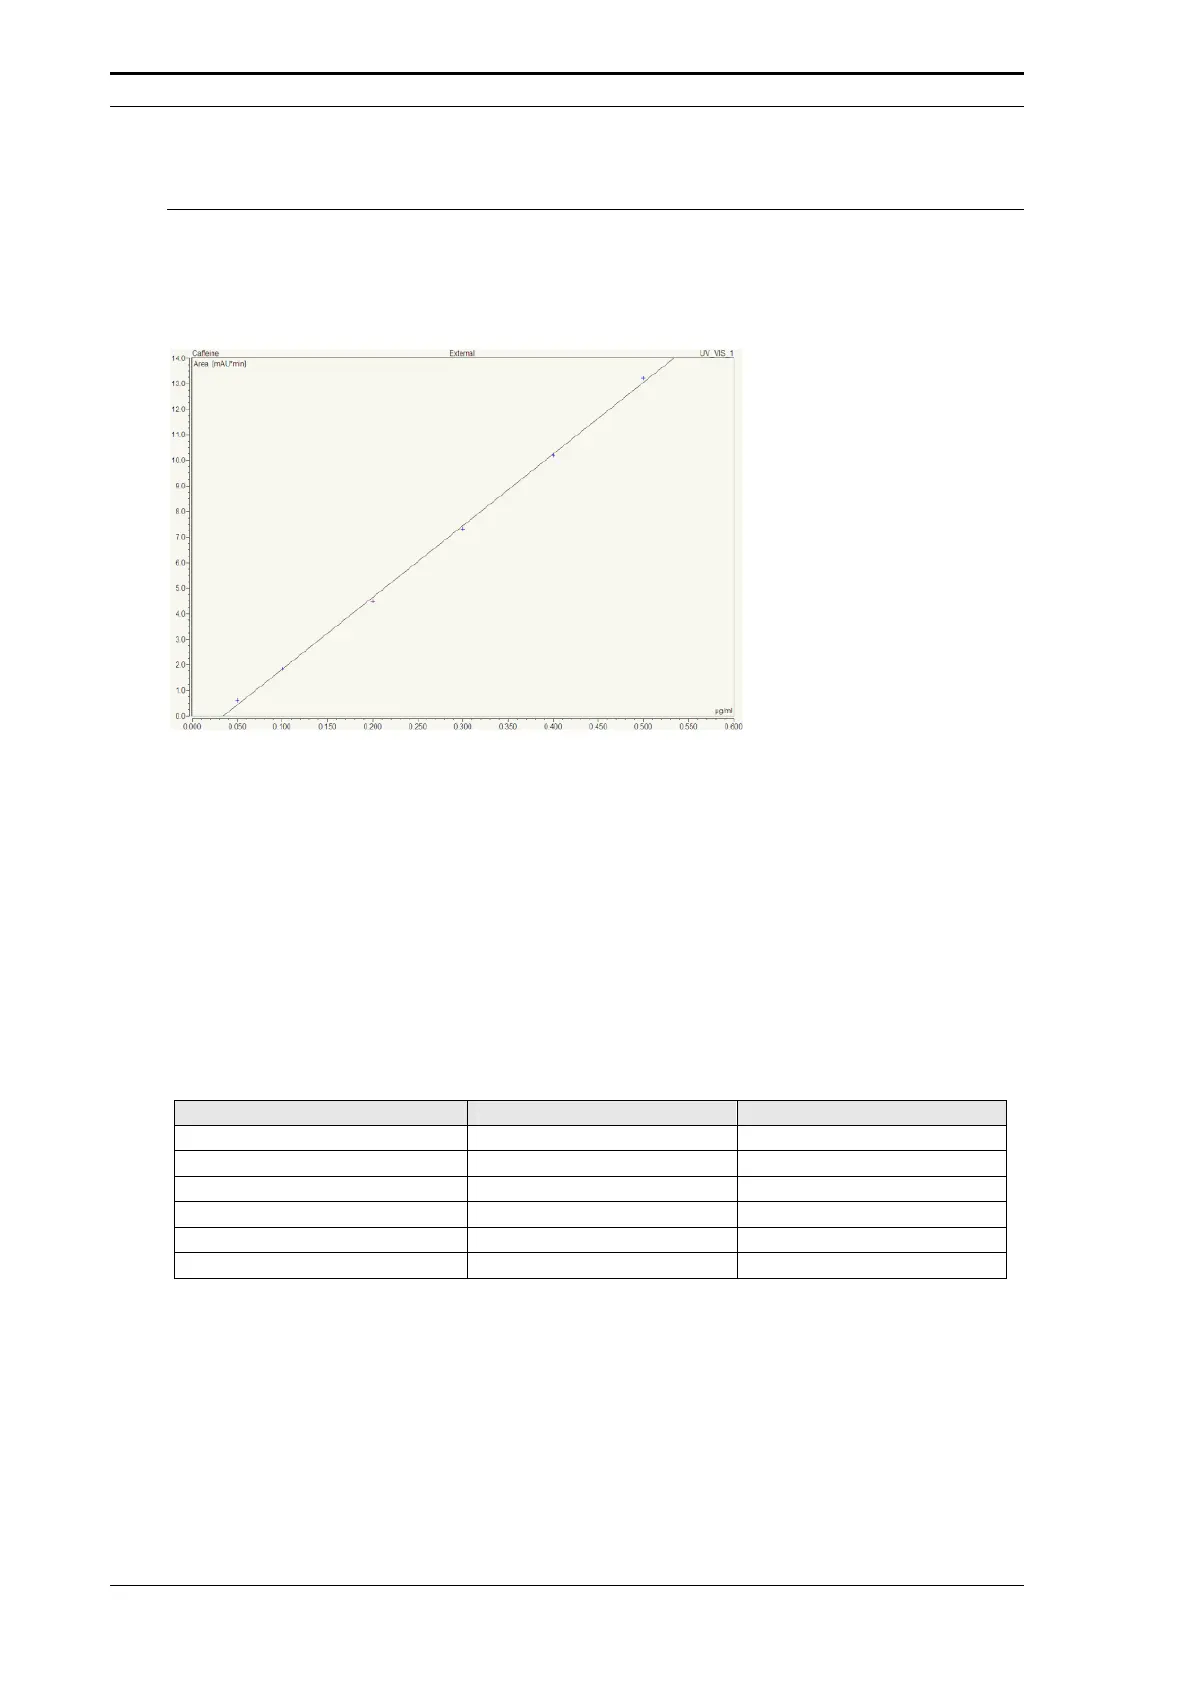
An example of a calibration curve is presented in FIGURE 4-9.
FIGURE 4-9 Example of a Calibration Curve -
Nano LC system, 99.96 % Correlation Coefficient
4.9.1 Performing the Test
a) Setup the UltiMate system and the FAMOS Microautosampler as discussed in Sections
3.2.2 A and 3.2.2 B.
b) Start the flow delivery of the UltiMate Micropump from the CHROMELEN control panel.
c) After equilibration start the sequence ‘XQ_5_Autosampler Linearity_NAN’ (or ‘_CAP’,
respectively).
TABLE 4-3 Experimental Conditions – Repro Injection Volume
Parameter Nano Configuration Capillary Configuration
Detection wavelength 272 nm 272 nm
Run time 8 min 4 min
Flow rate
0.4 µL/min 4.0 µL/min
CRP 625 50
Injection loop
1.0 µL 1.0 µL
Injection type Partial Loop Fill, 0.2 µL Partial Loop Fill, 0.5 µL
To evaluate the result of the ‘Linearity of the Injection’ Test:
a) Use the quantization file ‘caffeine.qnt’.
b) Check the integration and correct if necessary.
c) Calculate the correlation coefficient.
d) Verify that the correlation coefficient meet the acceptance criteria (TABLE 2-3).