© 2017 Thorlabs GmbH18
PM400
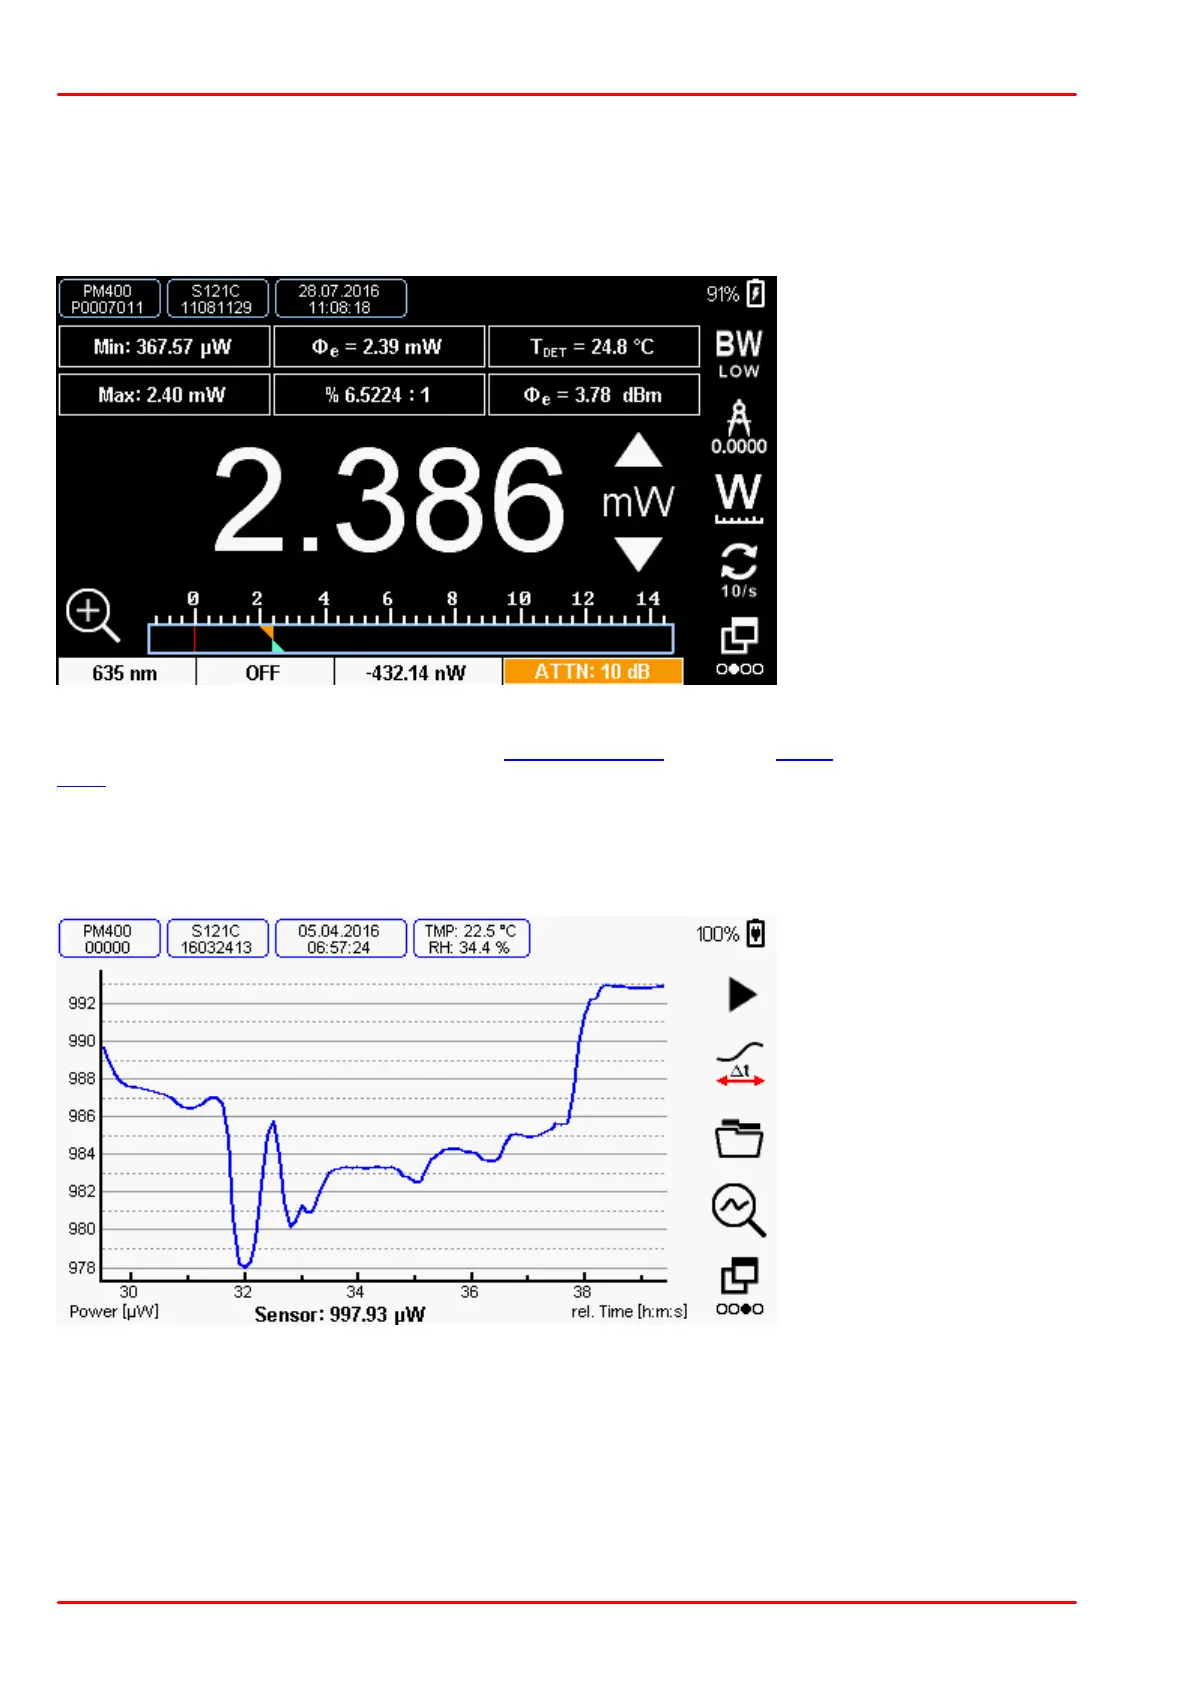
Numerical Display
Numerical display with bar graph. This view has six additional small configurable displays with
additional, sensor specific information.
The sub-display configuration is accessible by drop down menus.
Numeric Display - Photodiode Sensor with External 10 dB Attenuator
Bandwidth Setting
Resolution of the digital
value
Toggle to change units
Display Update rate
Next Screen
The lower display bar shows from left the set wavelength, status of Delta measurement and the
Zero compensation value.
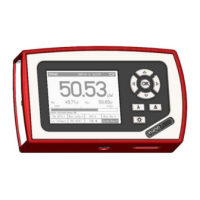
Graph Display
The graph display allows to capture measurements over time and to analyze the results.
Graph Display in Capturing Mode
Start / Stop Capturing
Show all results/
Roll latest
Open folder with captured
files
Analyze capture (Switch
to Viewer Mode)
Next Screen