V01.00 | 2021/11
25
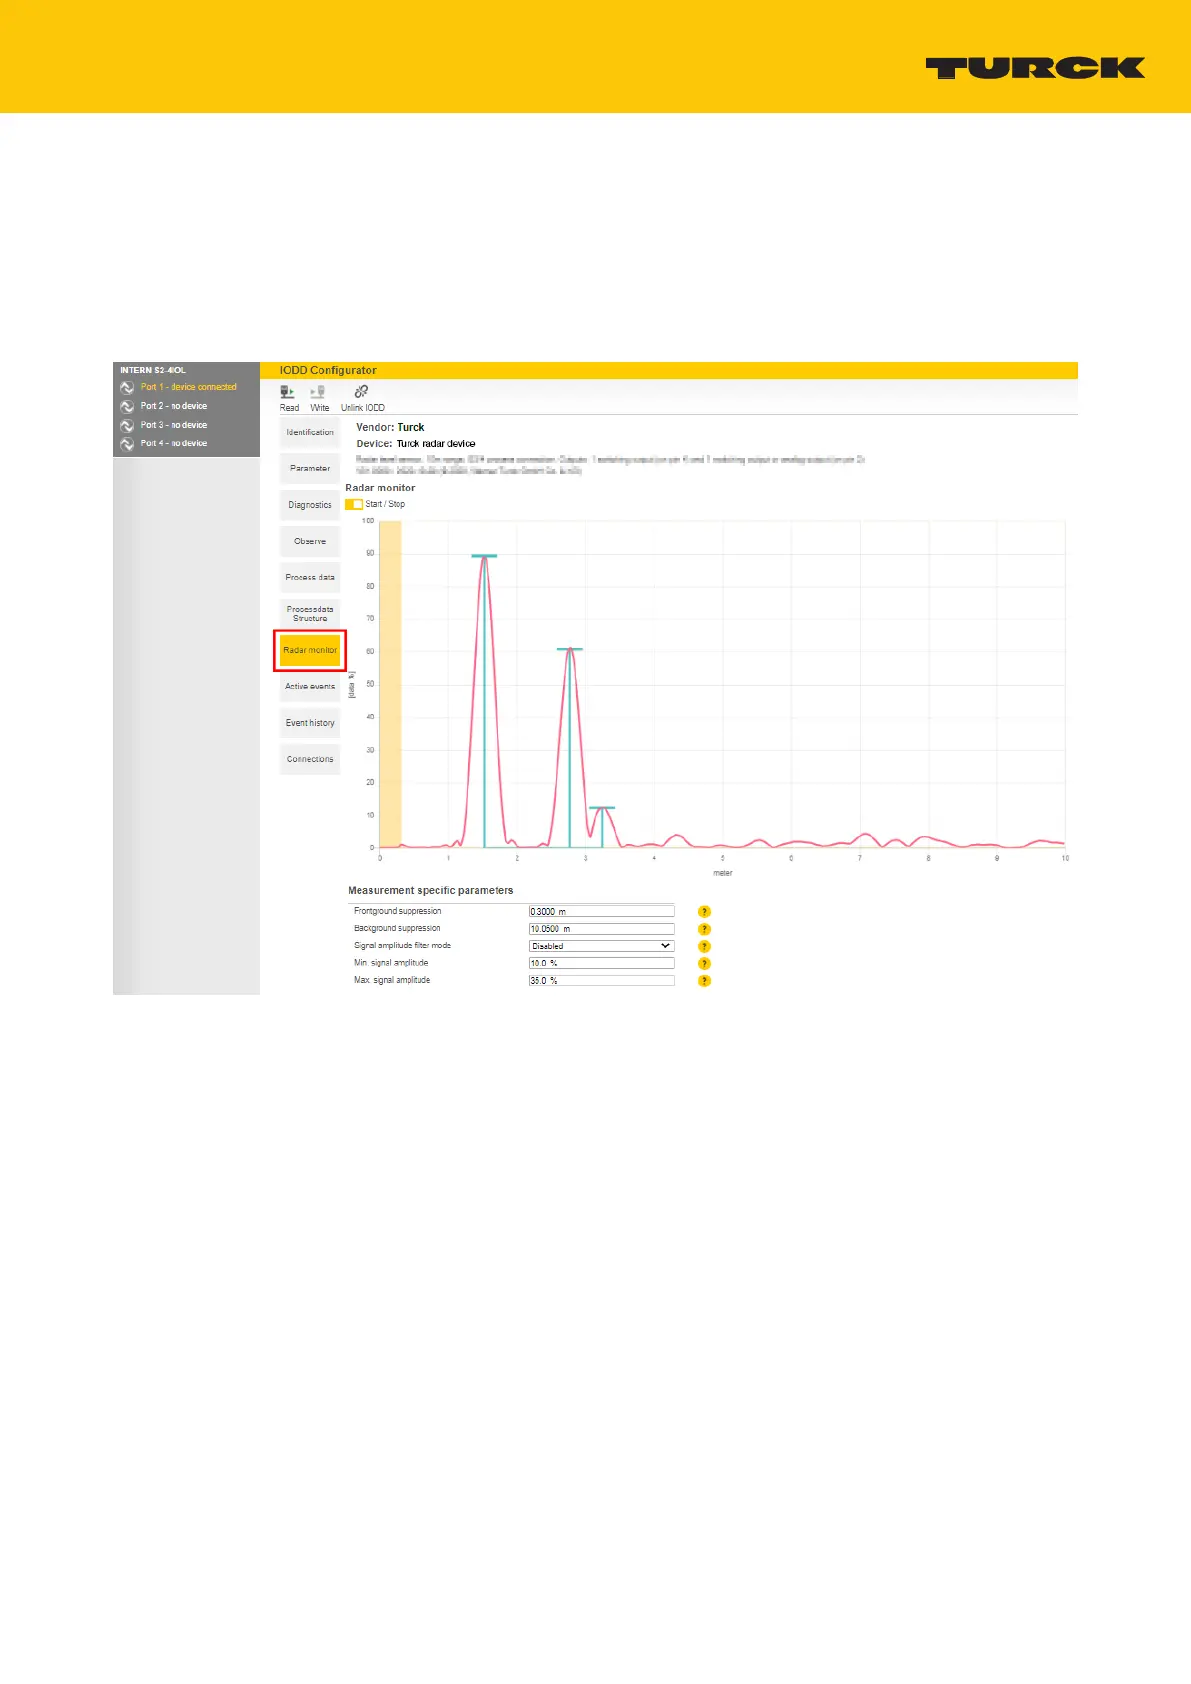
9.3.2 Turck Radar Monitor – overview
The Turck Radar Monitor makes it possible to visualize the process data and filter signals. The
display consists of:
n FFT diagram and envelope curve
n Object detection
To launch the Turck Radar Monitor, choose Radar monitor.
Fig.22: Turck Radar Monitor – overview
Each displayed peak represents an object detected by the sensor in the detection range. The
following points must be observed:
n Peaks with a blue bar (max. 10 value pairs consisting of distance value and intensity value)
are forwarded for signal processing.
n The first peak is output as a process value.
n Peaks below a device specific signal intensity limit are no longer detected.
n Background noise can produce small ghost objects (see distance range from approx. 5m in
the figure above).
 Loading...