Before starting the database creation, an electrical connection must be established between the GND point
of the electronic board to be registered and the black probe at the Probe-1 input.
After the PCB image is loaded, the database creation can be started. First, the point to be measured is
marked by clicking on the PCB image (Figure 21). Then, by touching the same point on the board with the
probe and the impedance curve appears on the chart, it is added to the list by clicking the “Add” button
(Figure 22). If no test point is selected in the list, the new point is added to the end of the list. If a new
record is added by selecting a point from the list, then it is added below the selected point. Thus, new data
can be added between the points in the list later.
If the name of a point in the list is desired to be changed, that point is selected first and then the “F2” key is
pressed. The name of the test point can now be changed.
If there are incorrect or undesired test points, they can be deleted from the list with the “Delete” button.
Or, if you want to change the order in the list, “Move Up” and “Move Down” buttons can be used. The
item can also be shifted by drag and drop method.
When the list is completed, the Save Data button is clicked and recorded to the disk. The extension of the
recorded file is “uce4” and does not include the board image. Therefore, it must be stored together with
the image of the board.
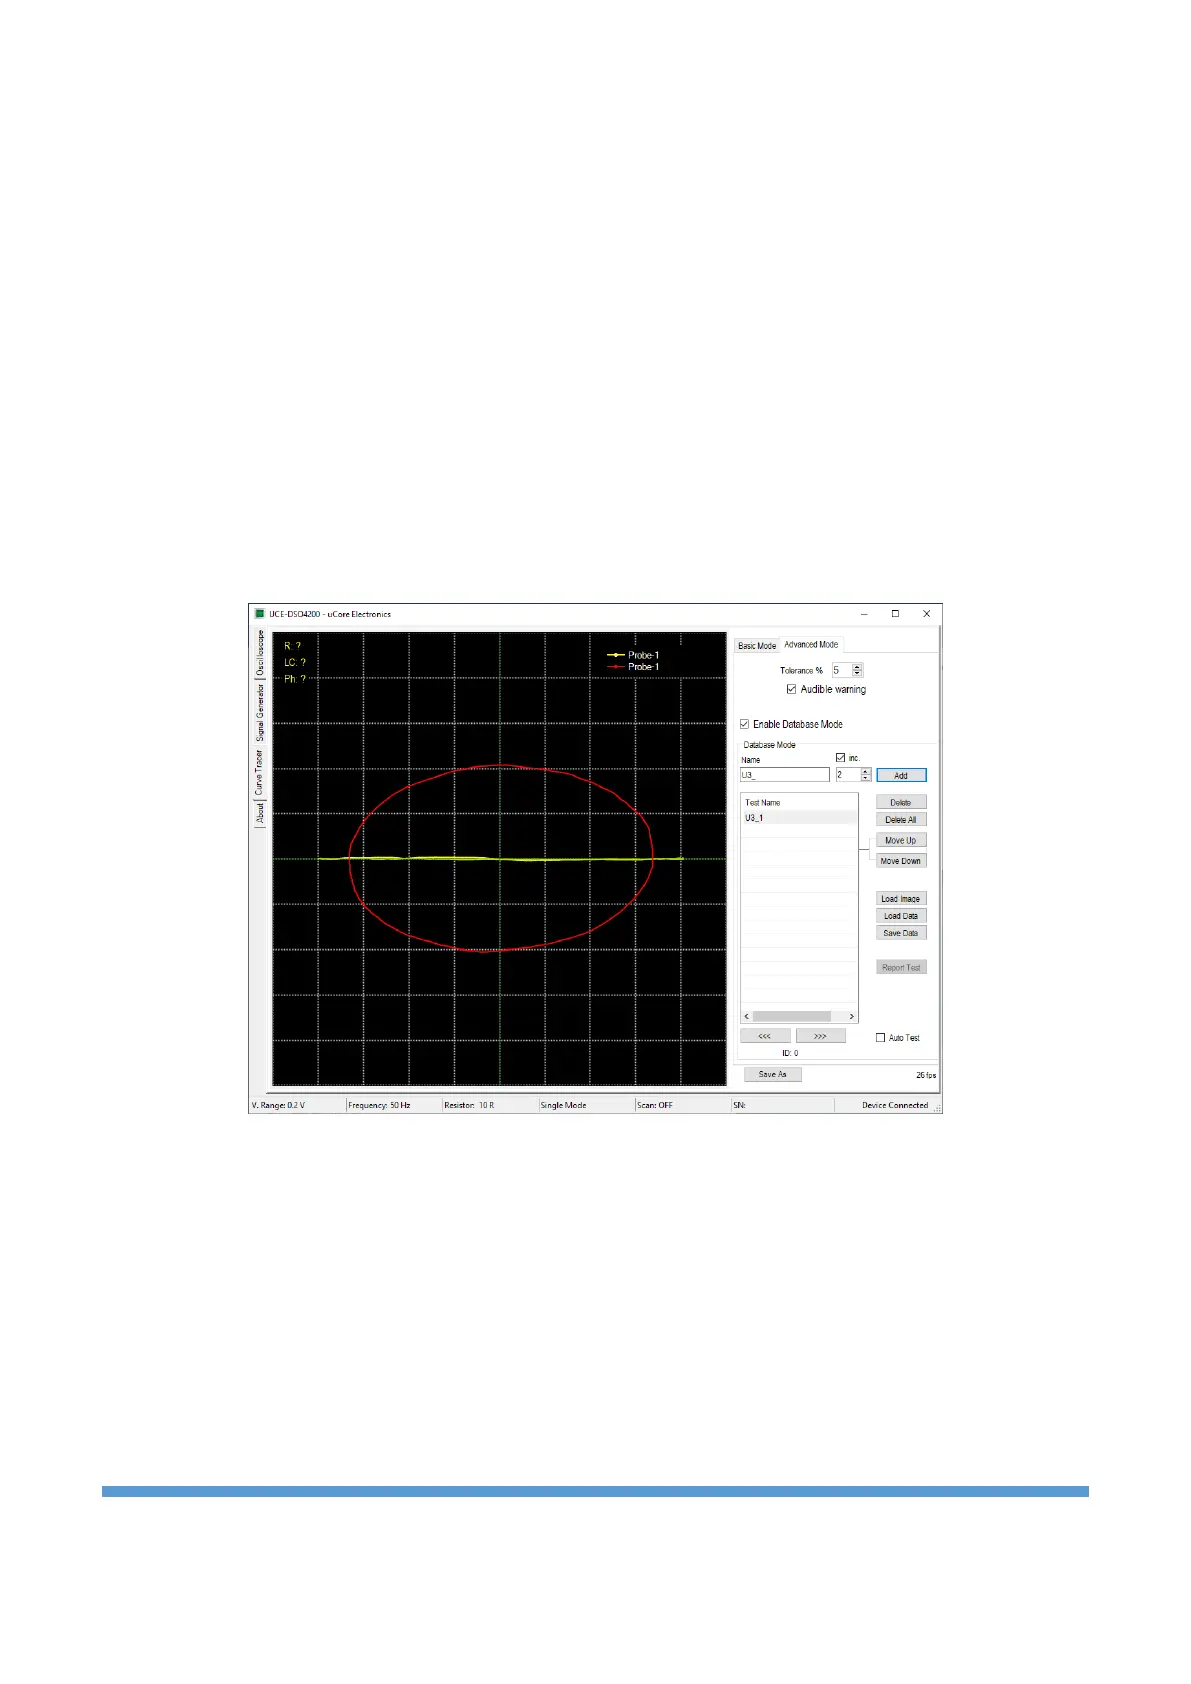
Figure 22. Creating a database
10.3.2. Comparison from database
In the “Advanced Mode” tab, the “Enable Database Mode” checkbox is checked to activate the database
mode. Then click the “Load Image” button. In the window that opens, the image of the electronic board to
be tested is loaded by clicking the “Load” button. Then, by clicking the “Load Data” button in the main
window, the digital data of the electronic board is loaded into the list. When the points in the list are
clicked, the position on the board and the impedance curve can be seen in the program. In Figure 23, when
the point recorded with the name U3_1 is clicked on the list, its position on the board image can be seen.
The red colored curve in the graph is the impedance curve for this point. The yellow curve is the impedance
curve read from the Probe-1 input.