7.1 XY Mode
The XY mode display is also called Lissajous graph.
When XY 1&2 are selected, the CH1 signal will be entered on the horizontal
axis (X), and the CH2 on the vertical axis (Y). In X-Y mode, when CH1 is
activated, use the horizontal POSITION knob to adjust the graph horizontally.
When CH2 is activated, use the horizontal POSITION knob to adjust the
graph vertically.The vertical SCALE knob to be used to adjust each channel’s
amplitude level. The horizontal SCALE knob can be used to adjust the time
position in order to obtain a well displayed Lissajous graph.
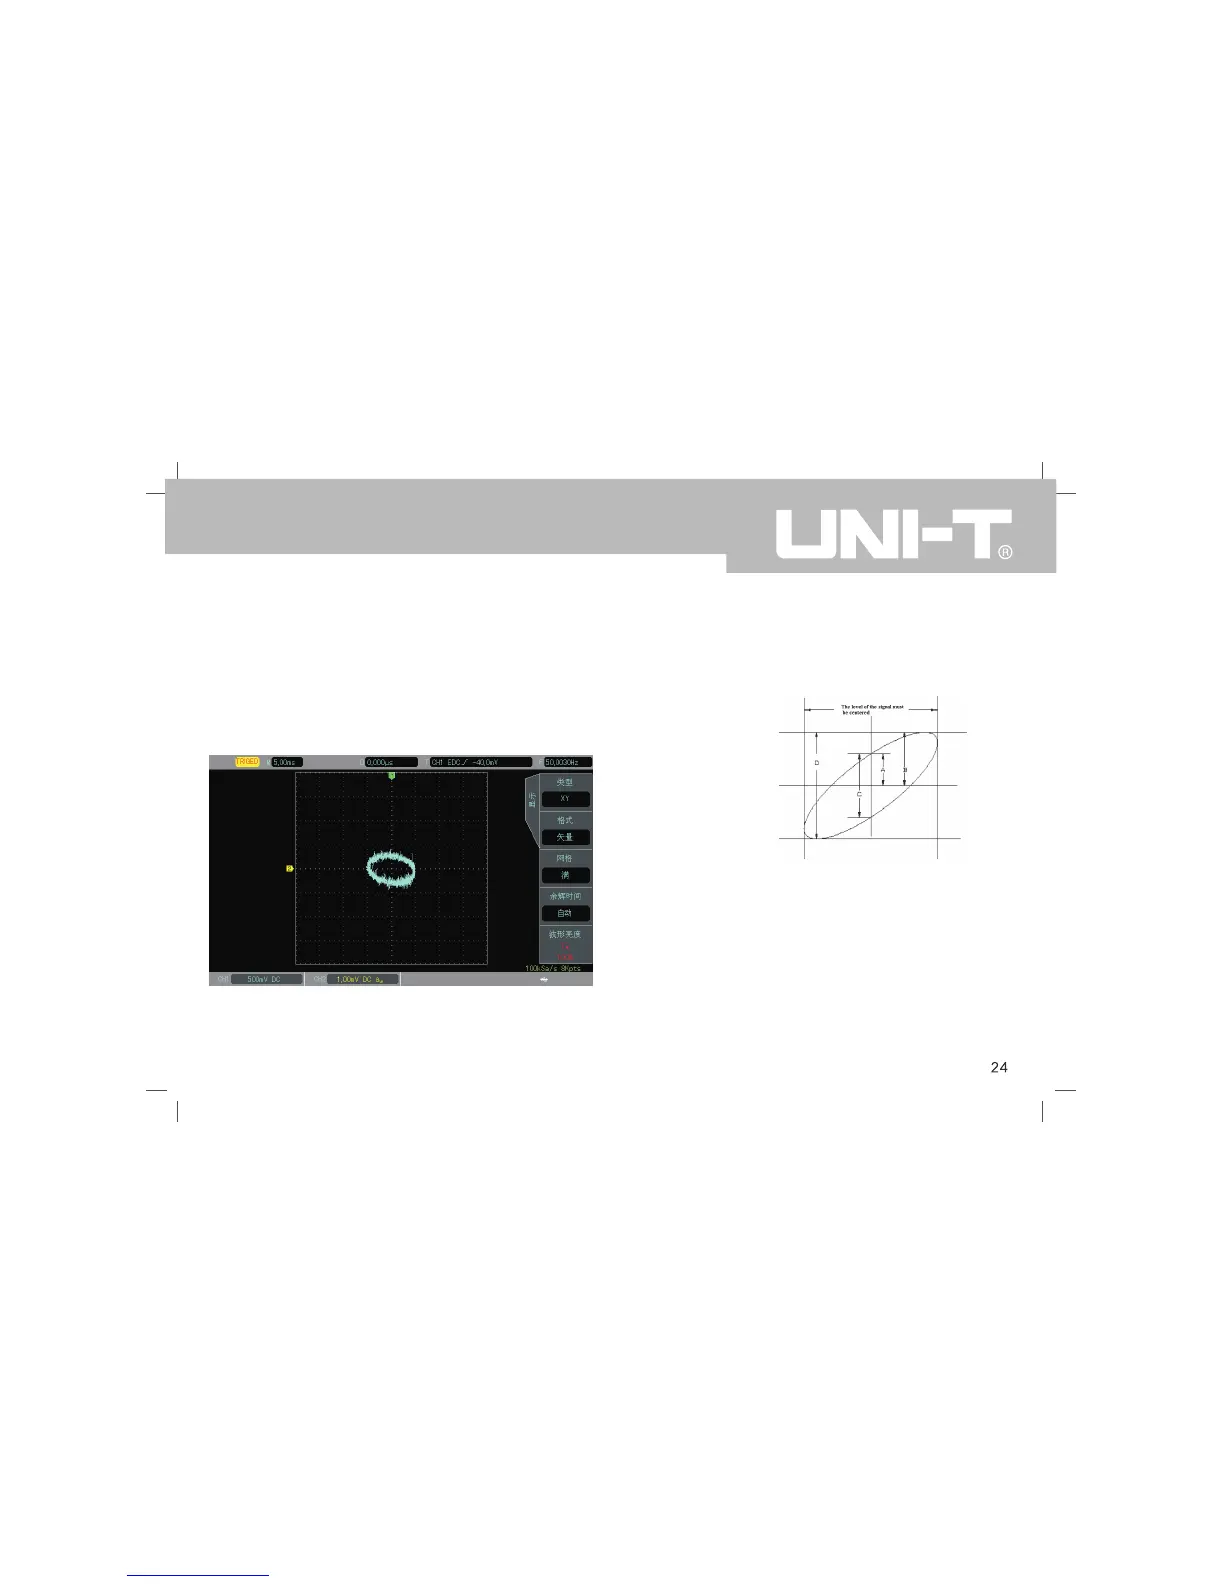
XY Display Mode
7.2 Application of XY Mode
The phase difference between the two signals of the same
frequency can be easily observed by Lissajous method.
The following chart gives the observation of phase
difference.
Since sinθ = A/B or C/D, theta (θ) is the angle between
the two signals, the definition of A, B and C, D is shown
above. We can draw a difference angle θ = ± arcsin(A/B)
or θ = ± arcsin(C/D). If the principal axis of an ellipse is
in quadrants I and III, then the phase angle should be
in I, IV quadrant, in 0 to (π / 2) or (3 π / 2) to 2 π. If the
principal axis of an ellipse in II, IV quadrant, then the
phase angle should be (π /2) to π or π to (3 π/2).
In addition, if the frequency or phase difference of the
two detected signals is an integer, the frequency and
the phase relationship between the two signals can be
calculated .
UTD2000CEX-II User Manual
 Loading...