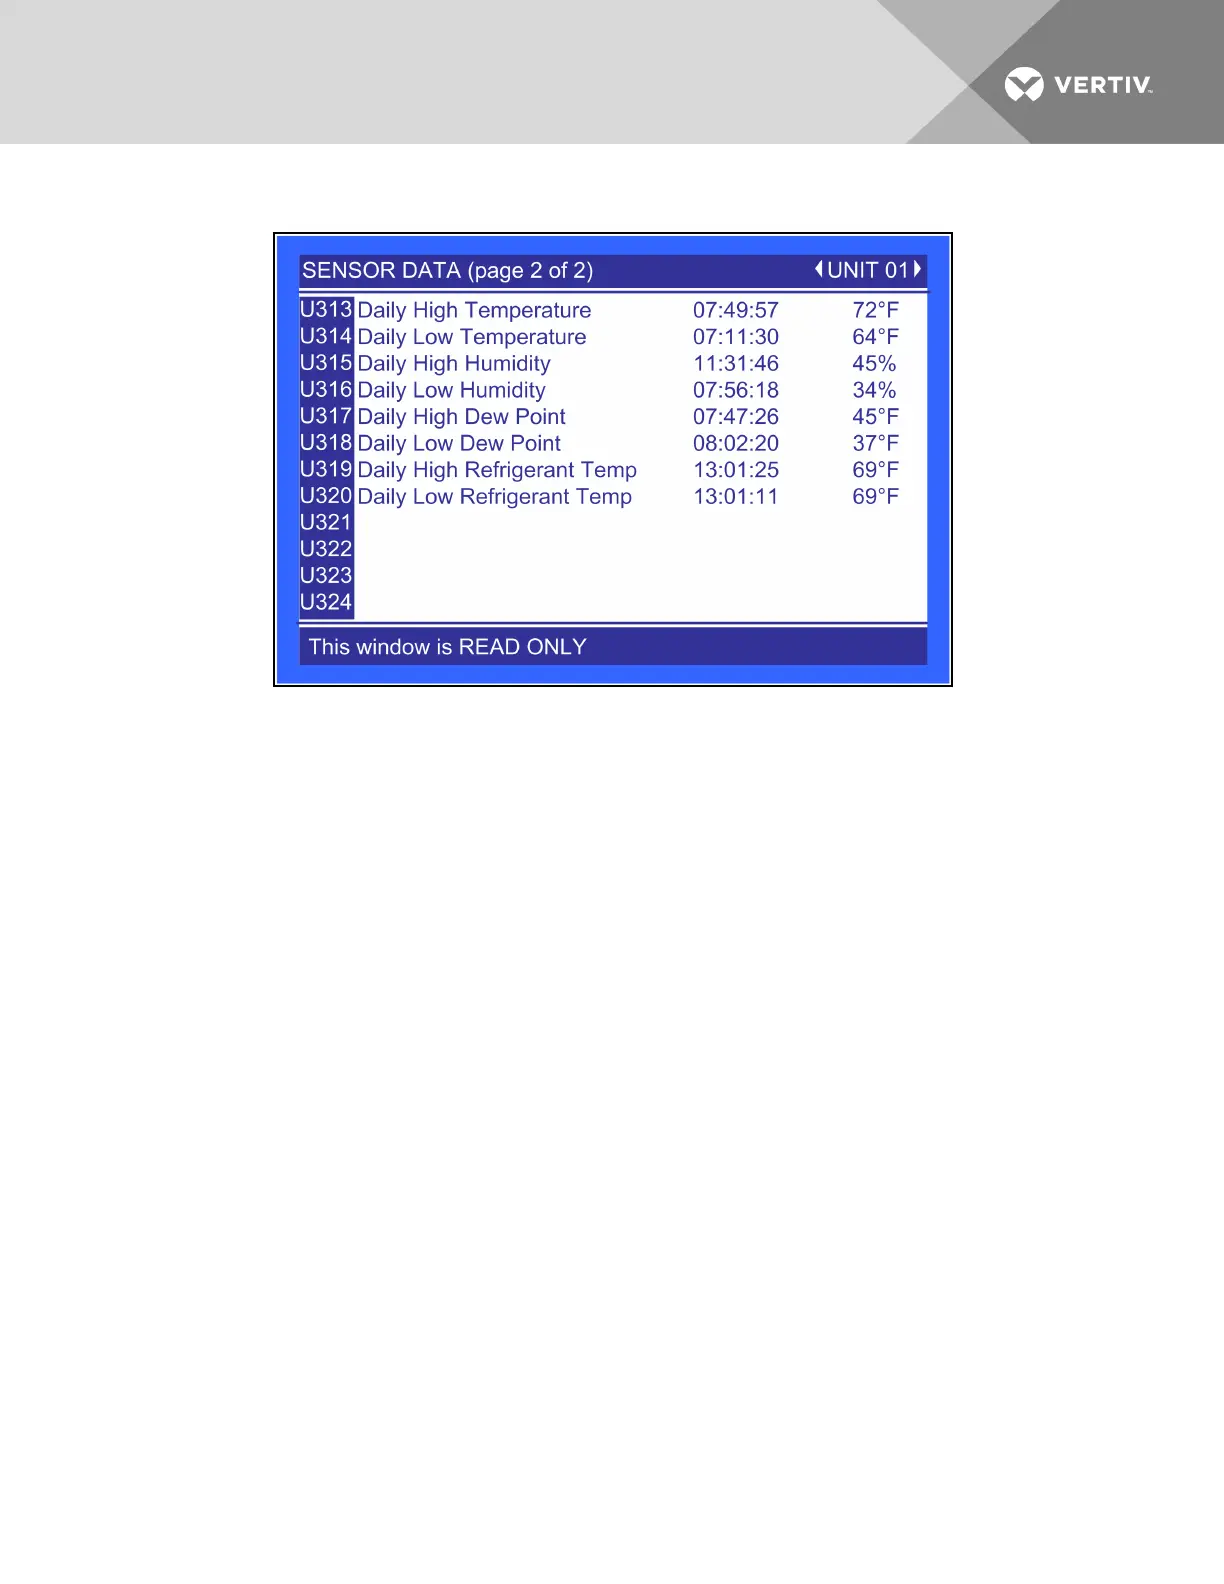
Figure 6.10 Sensor data, page 2 of 2
Daily High Temperature—Shows the highest temperature in a rolling 24 hour period for either remote
Sensor A or remote Sensor B.
Daily Low Temperature—Shows the lowest temperature in a rolling 24 hour period for either remote
Sensor A or remote Sensor B.
Daily High Humidity—Shows the highest humidity in a rolling 24 hour period for either remote Sensor A or
remote Sensor B.
Daily Low Humidity—Shows the lowest humidity in a rolling 24 period for either remote Sensor A or
remote Sensor B.
Daily High Dewpoint—Shows the highest dew point in a rolling 24 hour period for either remote Sensor A
or remote Sensor B.
Daily Low Dewpoint—Shows the lowest dew point in a 24 hour period for either remote Sensor A or remote
Sensor B.
Daily High Refrigerant Temperature—Shows the highest supply refrigerant temperature in a rolling 24
hour period from the Liebert XDC to the modules
Daily Low Refrigerant Temperature—Shows the lowest supply refrigerant temperature in a rolling 24
hour period from the Liebert XDC to the modules.
Vertiv | Liebert® XDC™ User Manual | 73