Representing spectra as vectors 5-3
• Length – Proportional to analyte concentration.
• Direction – Determined by the relative absorbance of the analyte at all
wavelengths (its absorbance spectrum). Direction is independent of
concentration for peaks that are less than 1.0 absorbance units (AU)
across the collected wavelength range.
Vector direction contributes to the identification of a compound, because the
direction is a function of the absorbance compound’s spectrum. The ability of
spectral vectors to differentiate compounds depends on the resolution of
spectral features. As both wavelength range and spectral resolution increase,
the precision of a spectral vector for the resultant spectrum increases. A
detector-derived vector can include absorbances in the range of 190 to 800 nm.
To enhance spectral sensitivity, set the bench resolution to 1.2 nm.
Tip: Do not include wavelengths where there is no analyte absorbance.
Vectors derived from two wavelengths
The spectral contrast algorithm uses vectors to characterize spectra. To
understand the vector principle, consider two vectors, in the figure below,
which are based on the spectra depicted in the previous figure.
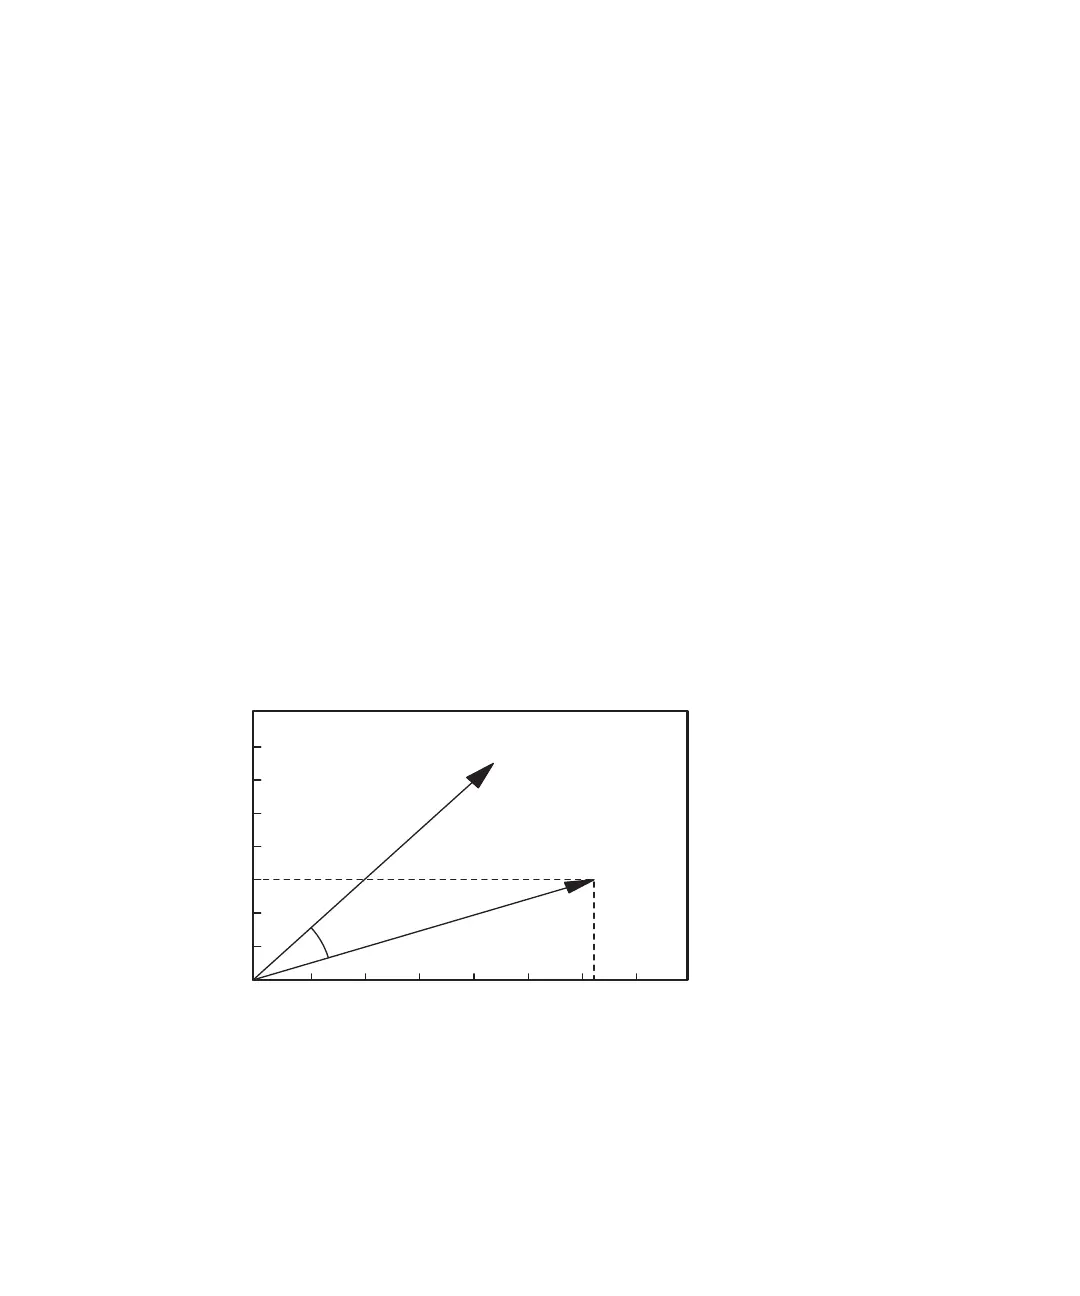
Plotting vectors for two spectra
In this figure, the axes reflect the absorbance units of the two wavelengths
used to calculate the absorbance ratio of the previous figure. The head of the
vector for Compound A lies at the intersection of the absorbance values (for
TP0283
0 0.1 0.2 0.3 0.4
0.1
0.2
0.3
0.4
AU at 245 nm
AU at 257 nm
θ
Compound B
Compound A