5-2 Spectral Contrast Theory
Comparing absorbance spectra
When measured at specific solvent and pH conditions, the shape of a
compound’s absorbance spectrum characterizes the compound. The varying
extent of UV/Vis absorbance occurring at different wavelengths produces a
unique spectral shape.
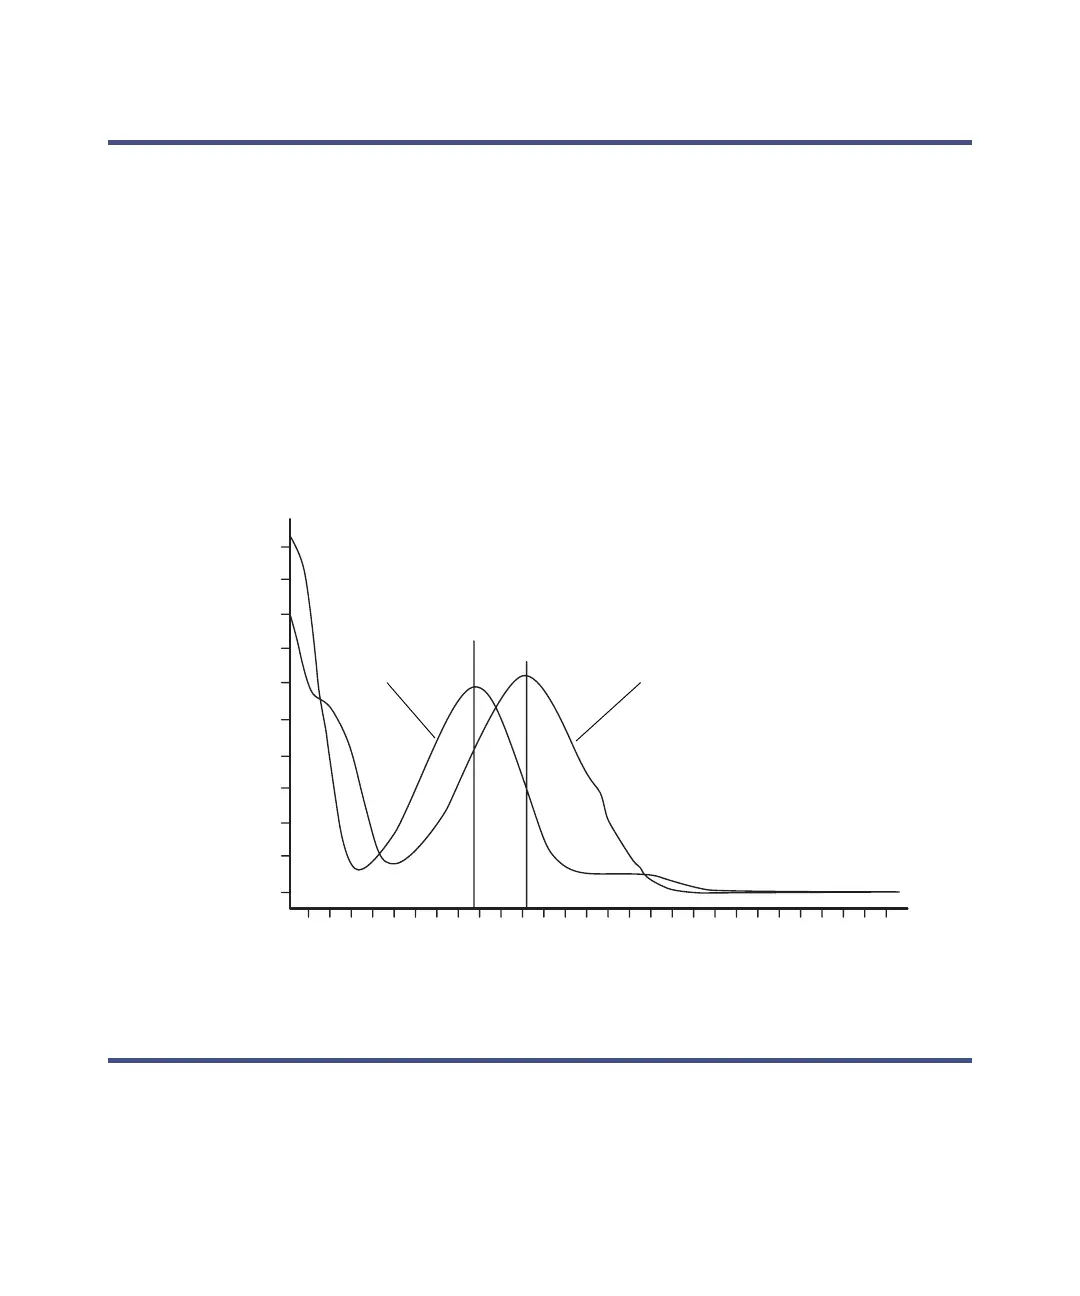
The following figure shows the absorbance spectra for two compounds, A and
B. The ratio of the absorbance at 245 nm to that at 257 nm is about 2.2 for
compound A and 0.7 for compound B. Note that this comparison of a single
wavelength pair’s absorbance ratios yields little information about a
compound. For more information, you must compare the ratios of multiple
wavelength pairs.
Comparing spectra of two compounds
Representing spectra as vectors
The spectral contrast algorithm uses vectors to quantify differences in the
shapes of spectra, converting baseline-corrected spectra to vectors and then
comparing the vectors. Spectral vectors have two properties:
Ab
245
Ab
257
--------------- 2 . 2=
Ab
245
Ab
257
--------------- 0 . 7=
Compound A:
Compound B:
nm
AU
220.00 240.00 260.00 280.00 300.00 320.00 340.00
0.40
0.20
0.00
Compound A Compound B
245 nm
257 nm