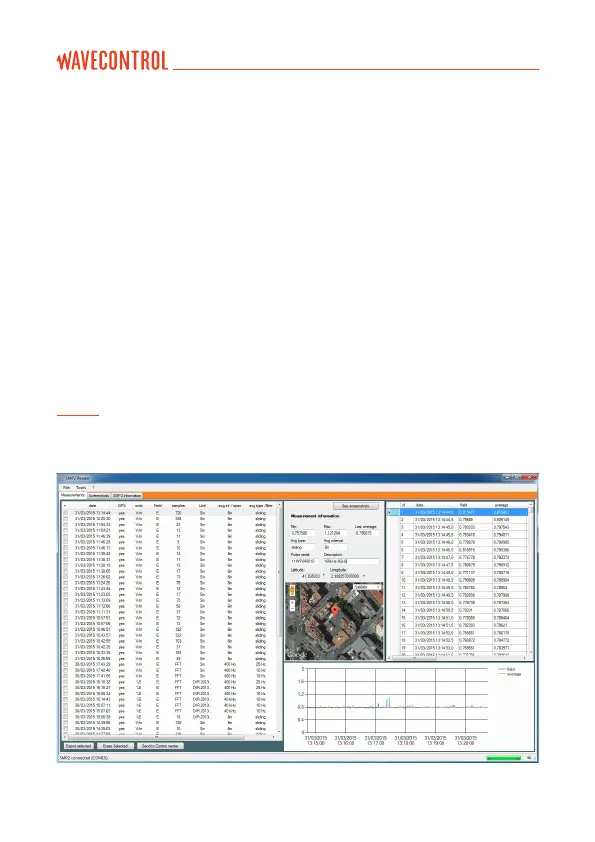
8.3.1. Measurements screen
Measurements are loaded automatically when the SMP2 is connected by USB.
A list will appear on the left with the measurements stored in the SMP2. When
you select a measurement, a table and a graph will appear on the right with all
the eld samples taken. A window will open to the left of the table with general
information on the measurement. This window includes a button for direct
access to the screenshots associated with the measurement. With an Internet
connection, a map will also appear with a position indicator if the GPS was
switched on during the measurement.
If you select a sample from the table, the program will trace a vertical red line
in the graph, and if you click on a point in the graph, the vertical line will move
to the position of the cursor and the corresponding sample will be highlighted
in the table. You can use this to nd maximum values, ordering samples by
value, by clicking on the Field heading.
Note: If the GPS was switched on during the measurements, the position data will
also appear in the table.
Figure 12: SMP2 software measurement screen
User’s Manual Electromagnetic Field Meter SMP2 P. 49