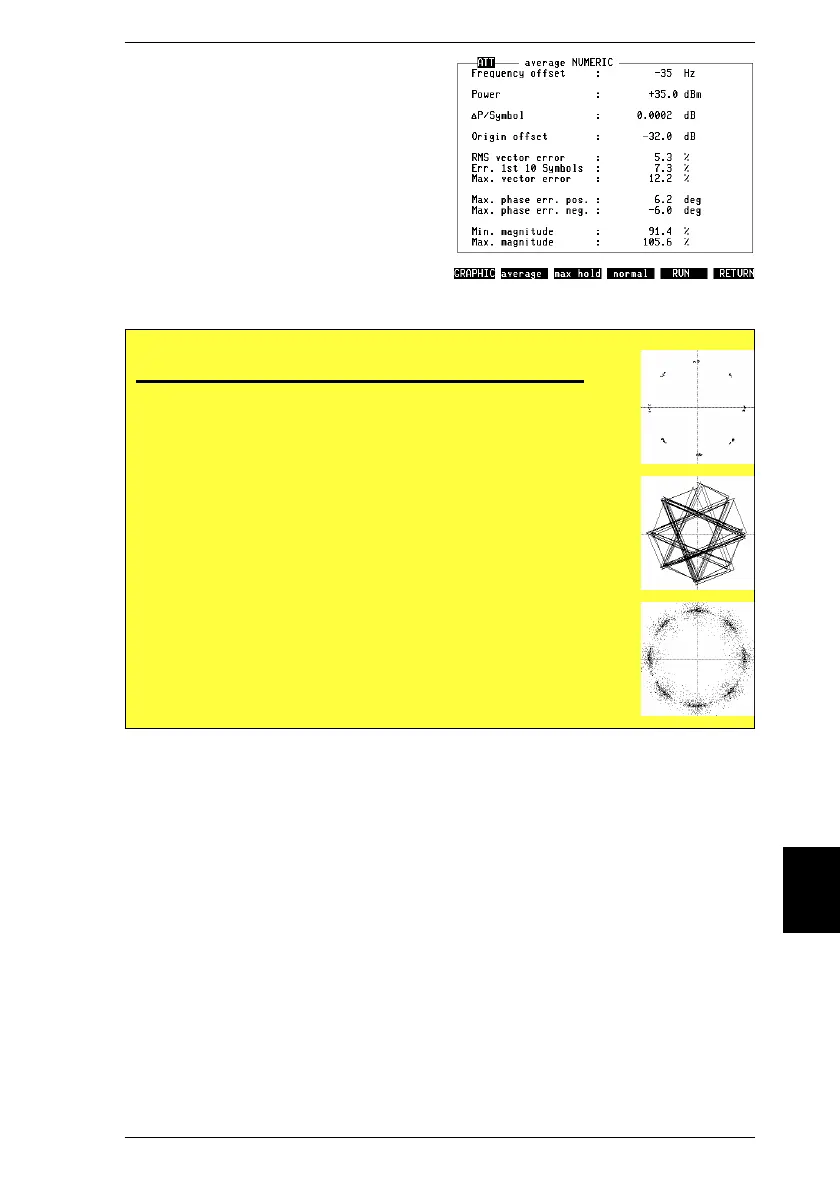
Fig. 10.21: In two result modes
{normal}
and
{average}
, measured figures are updated so fast
that exact visual evaluation is barely
possible. Result mode
{max.hold}
solves this
problem (display of maximum readings). ATT
draws your attention to compensation of
cable attenuation of test setup (see "General
Preparations").
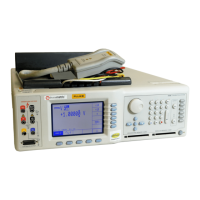
Available display modes
D = dots, the 156 points of maximum effect (POMEs) are shown
singly. This display, for a well adjusted mobile, shows eight tightly
limited accumulations of dots, offset by 45°. After the 156th value
the screen is extinguished and the next 156 dots are displayed.
L = lines, consecutive points of maximum effect are connected.
From this display it is possible to deduce the symbol contents
(data stream). Additionally you can detect phase errors very
clearly. A PRBS (pseudo-random bit sequence) generates a
closed figure. But, in practical terms, this display is just a pretty
show.
S = statistics, corresponds to the display as dots but without their
being extinguished after the 156th value. This makes it possible
to trace seldom occuring outliers (phase and magnitude). In con-
trast to the dots display the dimension of each dot is reduced to
50% due to better resolution in the statistics display.
10
Modulation Quality IS-136 MS
10-37