8 Meadowbank Road, Carrickfergus, BT38 8YF, Northern Ireland www.advancedsensors.co.uk
Page 87 of 93
OIW-HBO-0002-EX-005
OIW EX SERIES-SIDE STREAM
OPERATION MANUAL
Rev. 004 MAY 2015
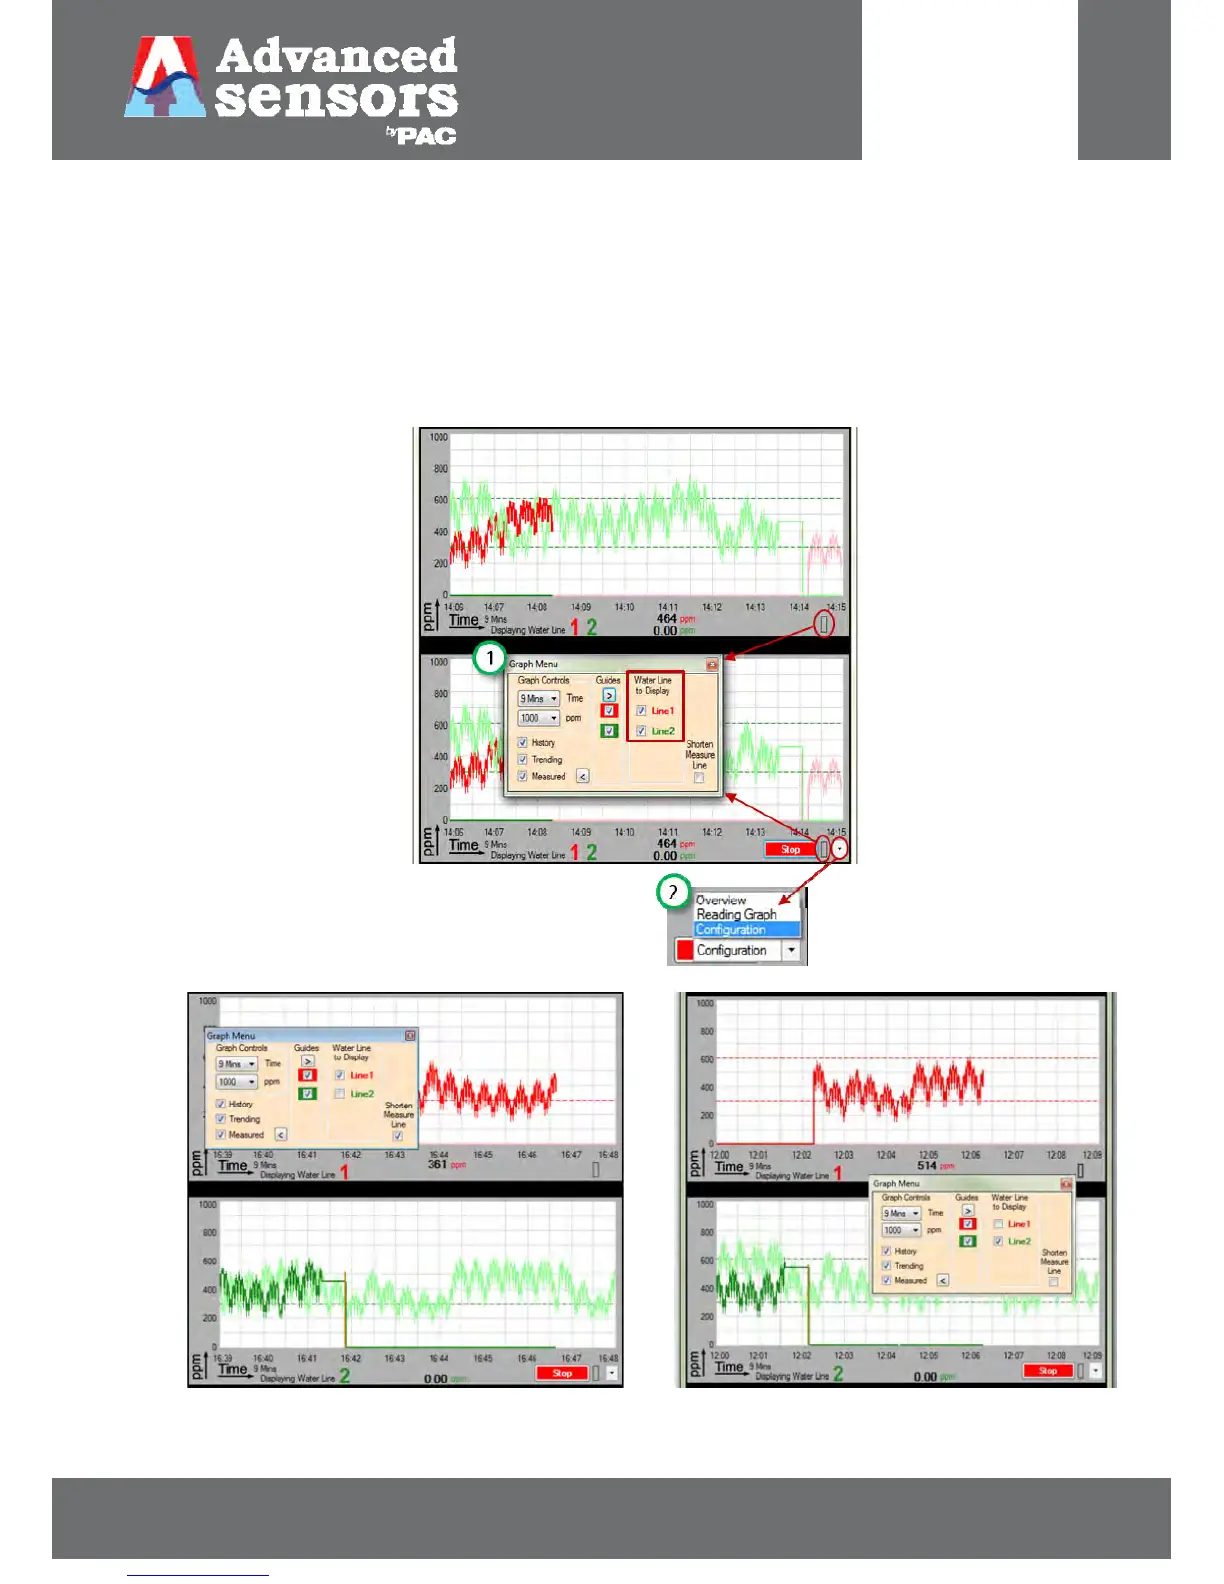
6.2.2.2 – Middle (and Lower) Panel: Graphical Display
The Graphical Displays, like with a single water line, can display multiple options. Each graph can display the
measurement data for each water line individually or both at the same time or a combination of water lines and
measurement readings (for EX-1000 models displays include spectral data). The Graph Menu, #1 in Figure 97 below,
includes a ‘Water Line to Display’ option. Users can select to display water line 1, water line 2 or both on the same
graphical display. Water line 1 will be in RED and water line 2 will be in GREEN. Use F2 to toggle between graphs in the
middle panel and use F3 to toggle the lower panel (or use the drop down arrow as shown in #2 in Figure 97).
Figure 97: Upper and lower graphical displays for a dual flow system with water lines 1 & 2 selected for display.
Figure 98: Upper and lower graphical displays for a dual flow system with individual water lines selected for
display.
 Loading...