26 Chapter 3
ACP Measurements
Measurement Results
Measurement Results
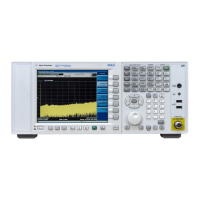
Press View/Display, and toggle the Bar Graph key to On to see the bar
graph with the spectrum trace graph overlay. The text window shows
the absolute total power reference, while the lower and upper offset
channel power levels are displayed in both absolute and relative
readings. See Figure 3-2.
Figure 3-2 ACP - Bar Graph View (Default)
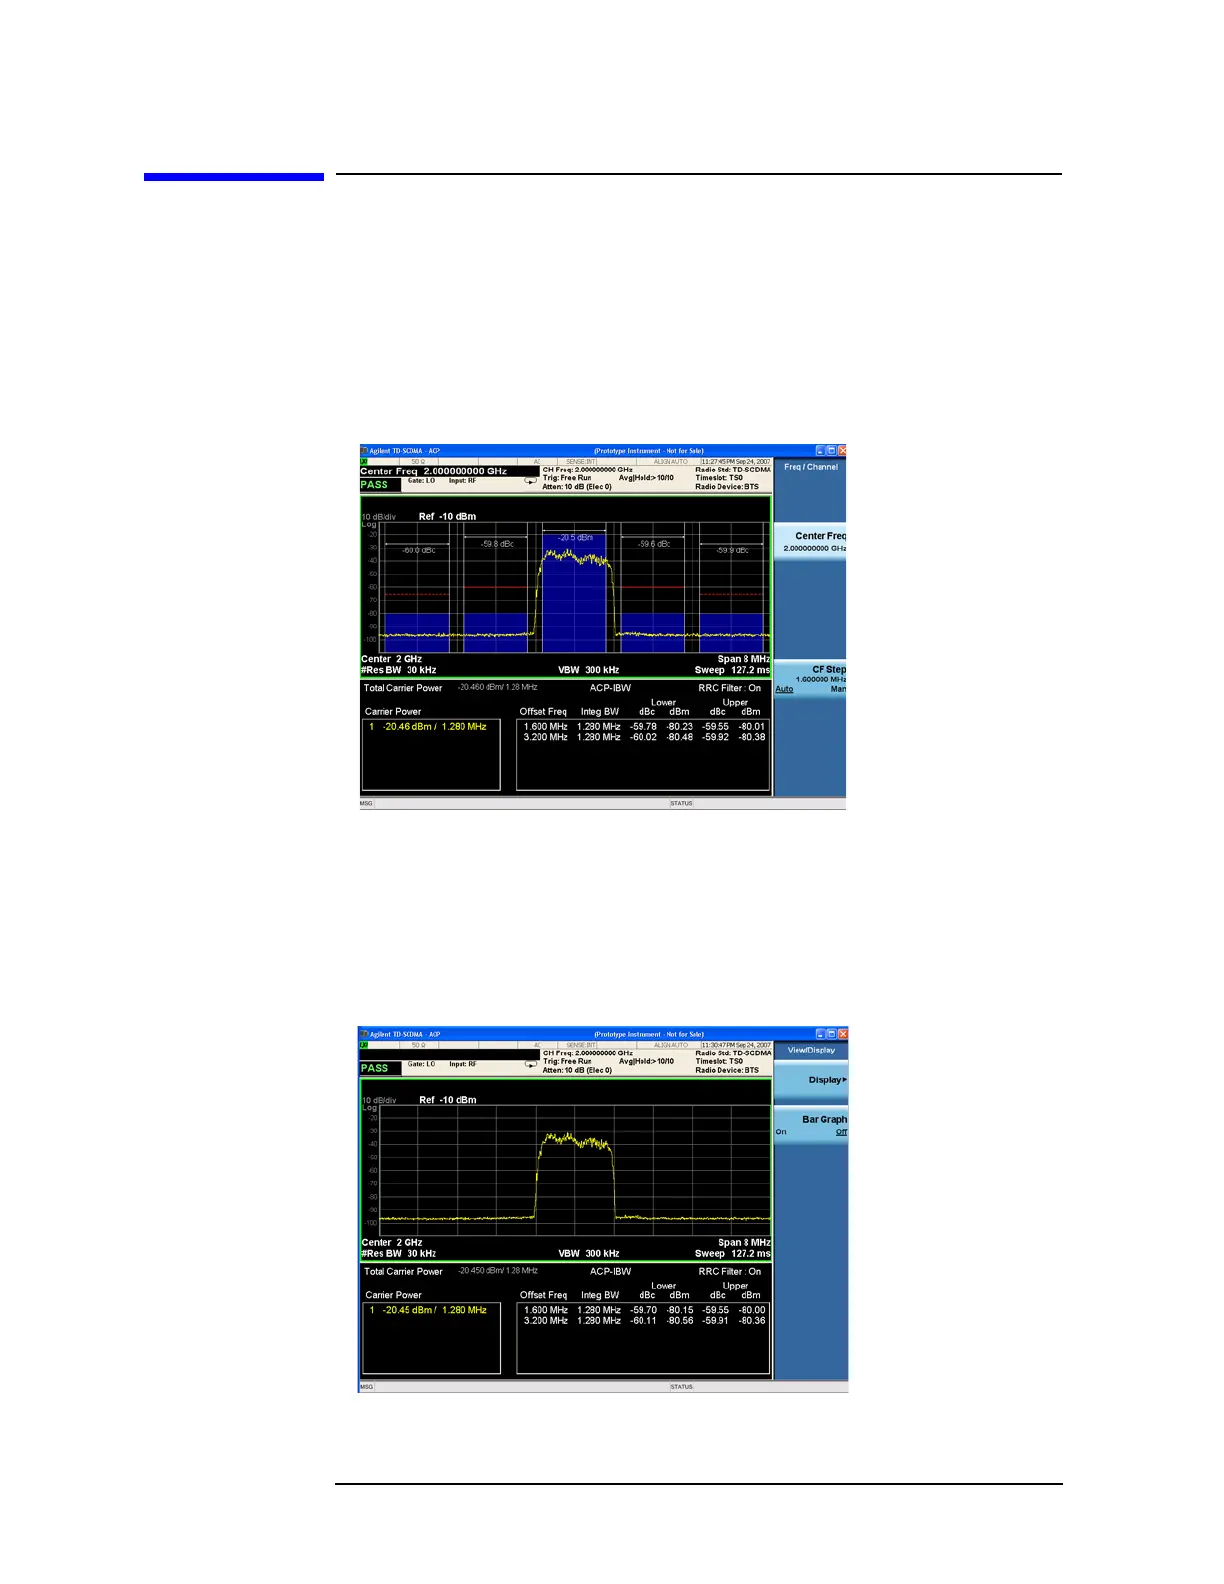
Press
View/Display, and toggle the Bar Graph key to Off to see the
spectrum trace graph. The spectrum graph measurement result should
look similar to Figure 3-3. The graph (referenced to the total power) and
a text window are displayed. The corresponding measured data is also
shown in the text window.
Figure 3-3 ACP - Bar Graph Off