Chapter 10 79
Code Domain Measurements
Results
Results
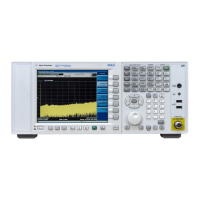
The measurement result should look similar to Figure 10-3. The graph
window is displayed with a text window below it. The text window
shows the total power level along with the relative power levels of the
various channels.
Figure 10-3 Code Domain Measurement - CDP Graph & Metrics View
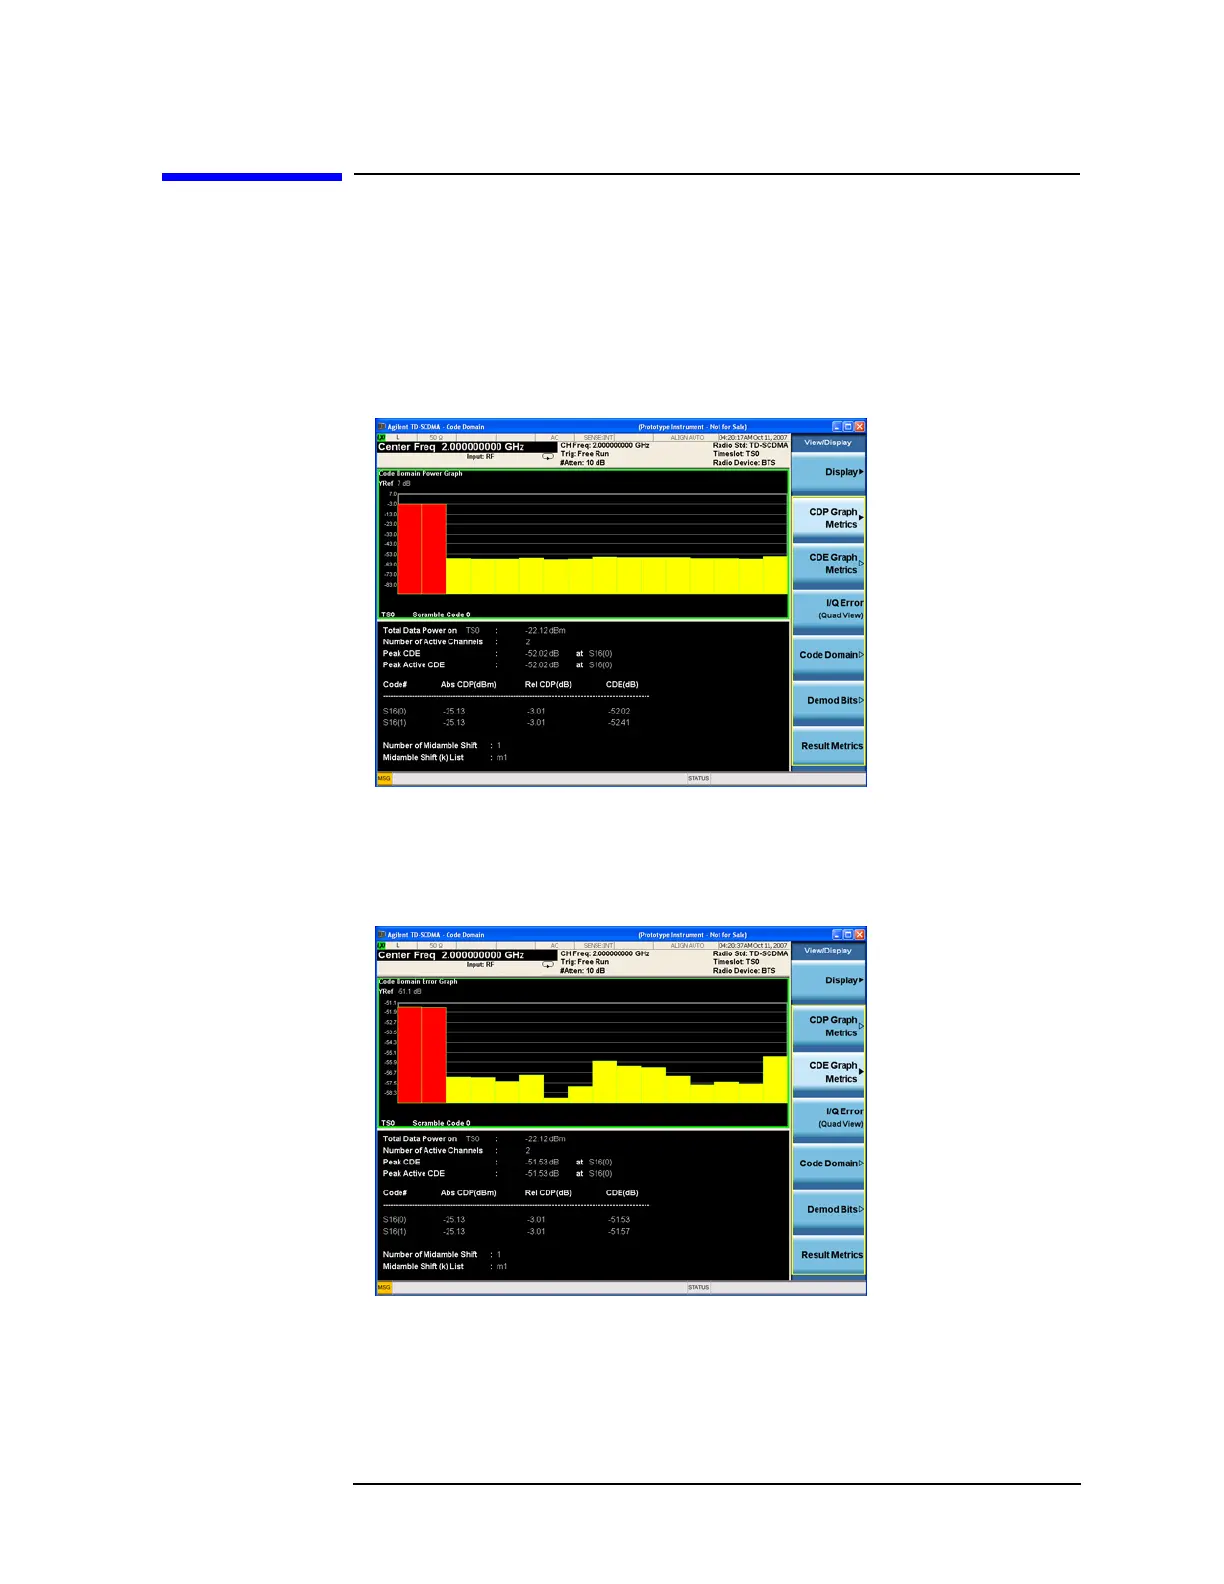
Figure 10-4 shows a combination view of code domain error graph
window and a text window.
Figure 10-4 Code Domain Measurement - CDE Graph & Metrics View