34 Chapter 4
Power vs. Time Measurements
Measurement Results
Measurement Results
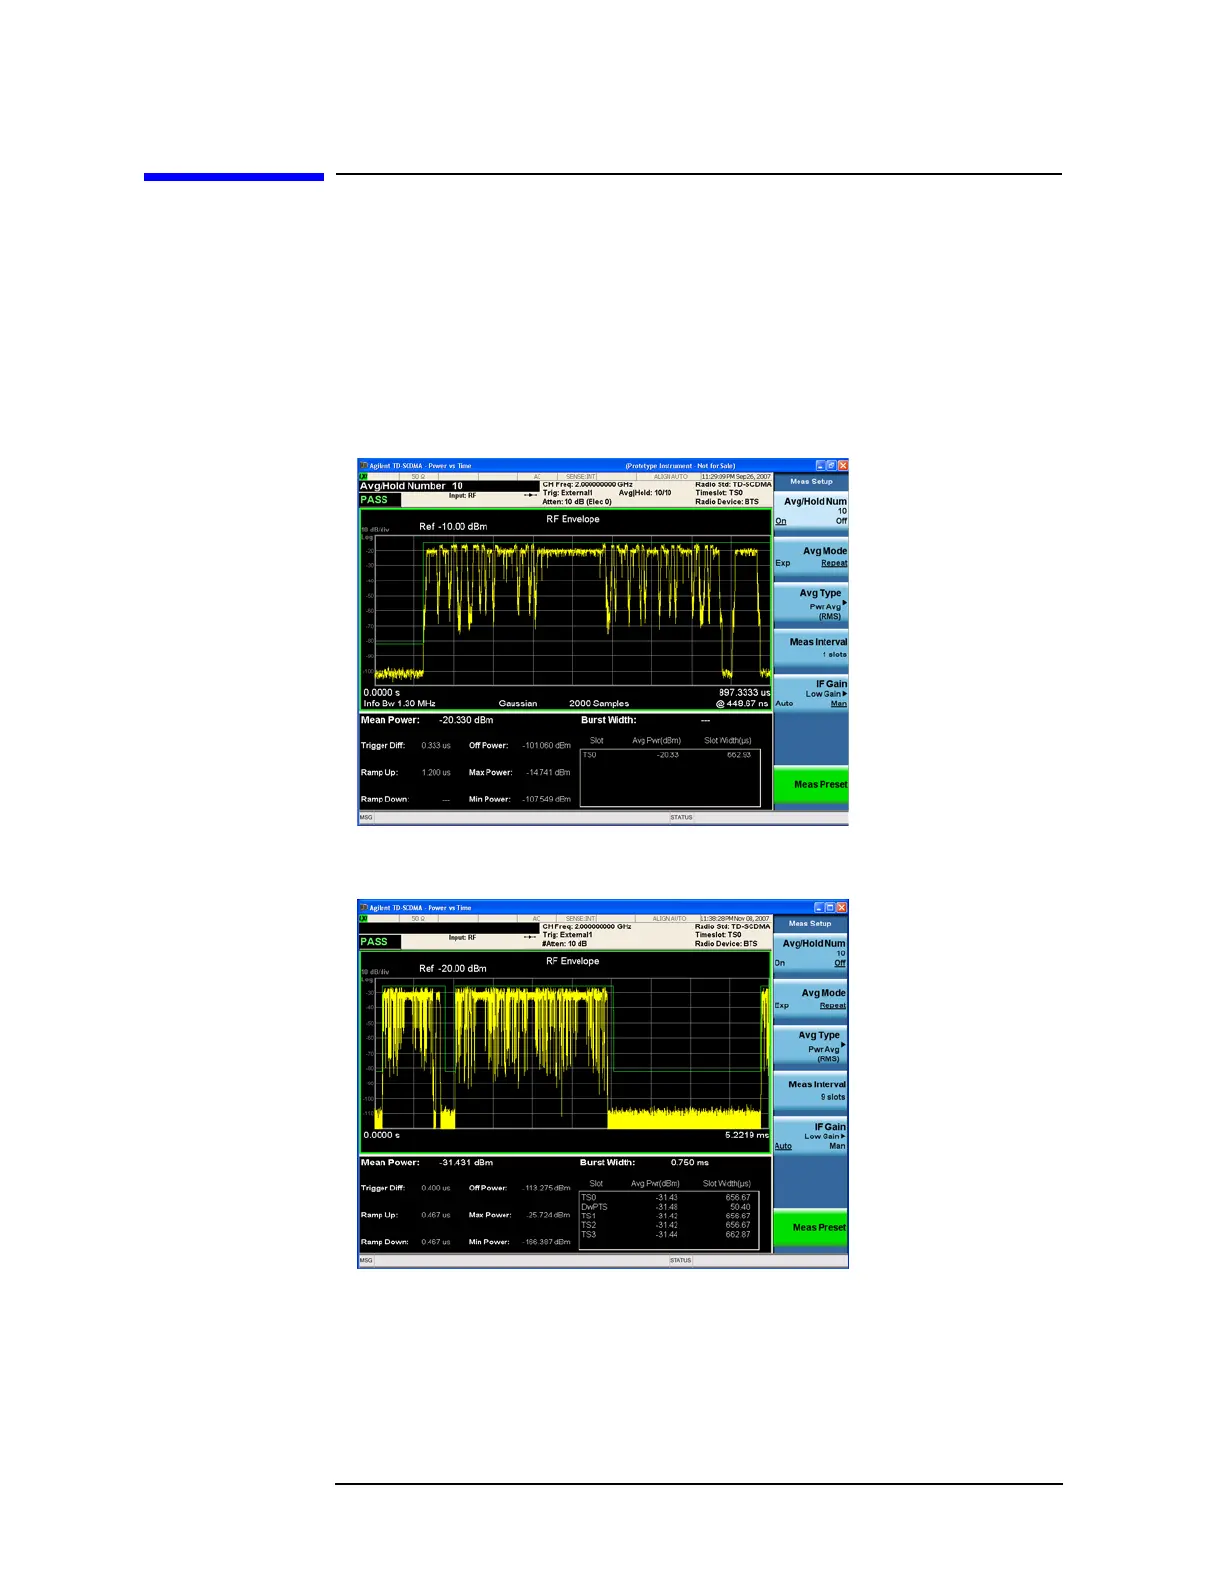
Figure 4-2 shows the Power vs Time in single timeslot.
The Mean Power is displayed on the left of the text window. If Meas
Interval is set to 2 or above, Burst Width will be displayed on the right
and the Avg Pwr and Slot Width of the each active timeslot are shown
in the box below. See Figure 4-3.
Figure 4-2 Power vs Time - Single-Slot View (Default)
Figure 4-3 Power vs Time - Multi-Slot View (Meas Interval = 9)