Chapter 6 49
Spurious Emissions Measurement
Measurement Results
Measurement Results
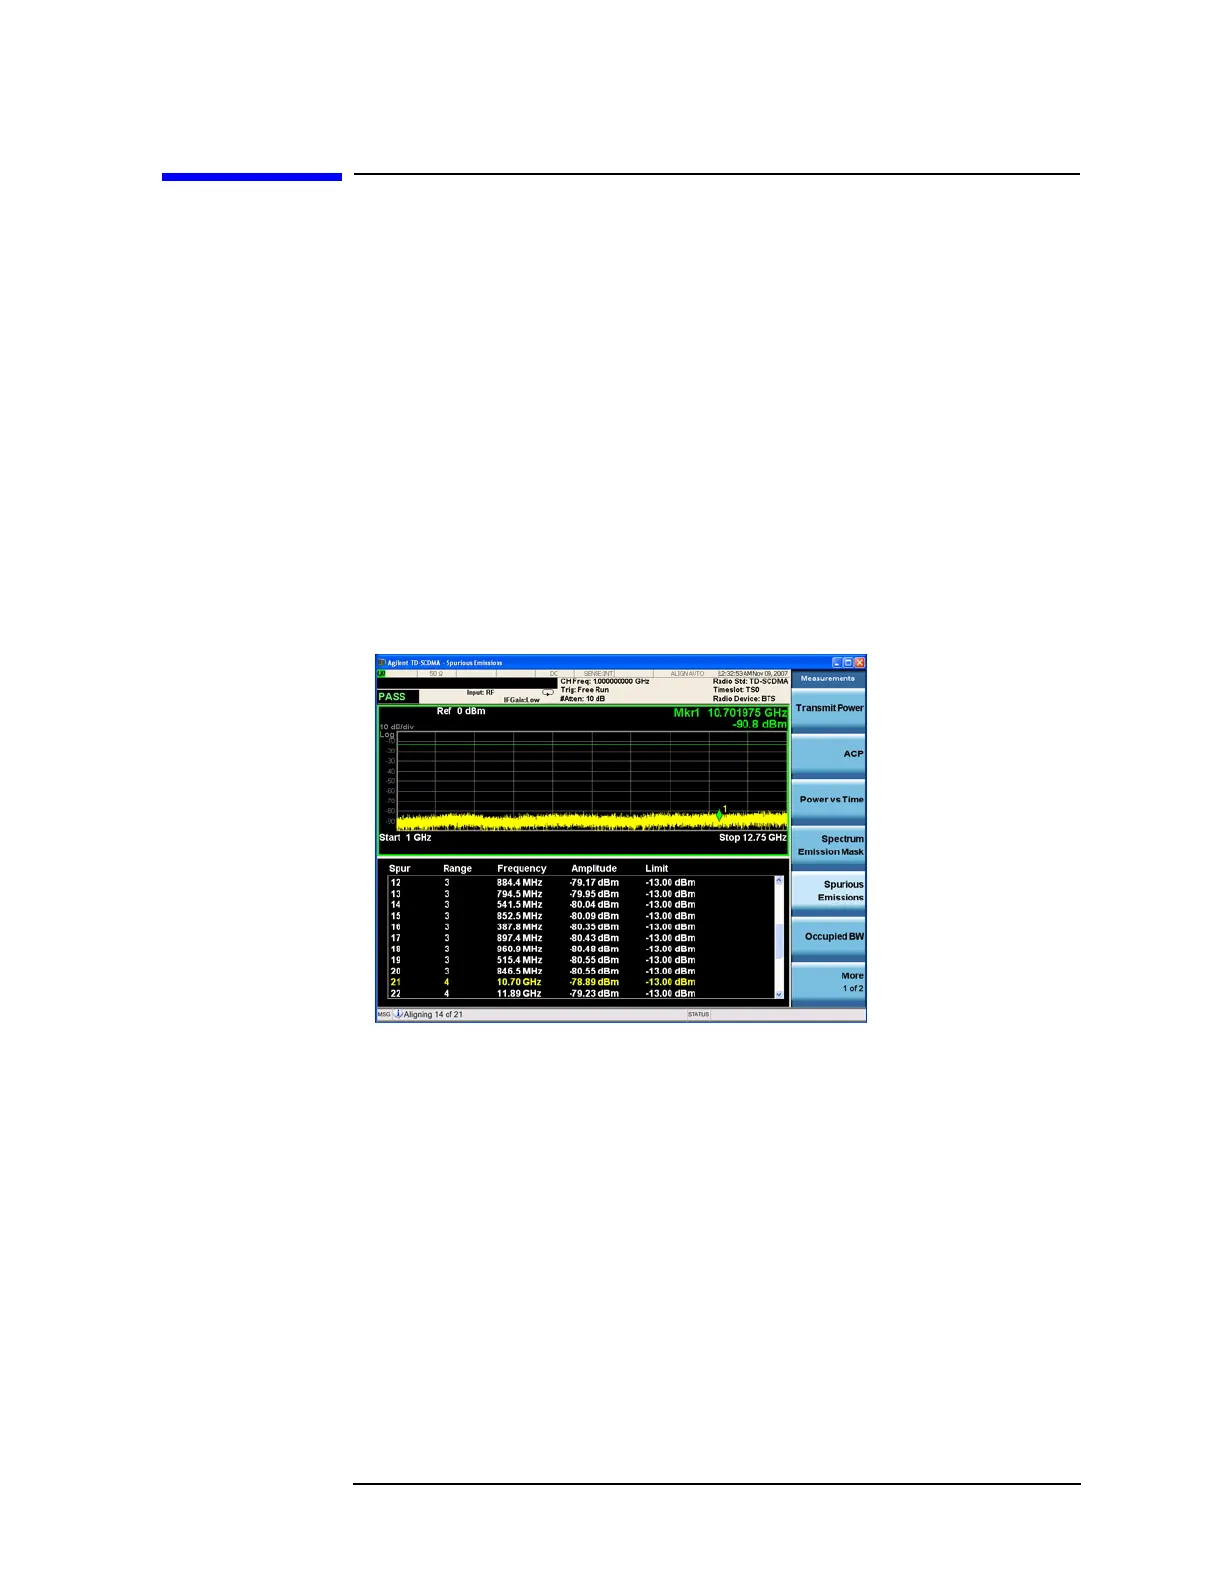
The Spurious Emissions measurement results should look similar to
Figure 6-2. The spectrum window and the text window show the spurs
that are within the current value of the Marker Peak Excursion setting
of the absolute limit. Any spur that has failed the absolute limit will
have an ‘F’ beside it.
The analyzer scans the band using the specified Range Table settings.
As each band is swept, any signal above the Peak Threshold and has a
peak excursion of greater than the Peak Excursion will be added to the
list of spurs in the text window. A total of 200 spurs can be recorded for
one measurement, with a limit of 10 spurs for each frequency range.
If no spurs are reported, but the measured trace exceeds the limit line
for any range, a red FAIL indicator will be displayed.
Figure 6-2 Spurious Emissions Measurement
If you have a problem, and get an error message, see the “Instrument
Messages Guide”.