Chapter 5 41
Spectrum Emission Mask Measurements
Measurement Results
Measurement Results
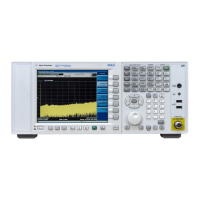
The Spectrum Emission Mask measurement result should look similar
to Figure 5-2. The text window shows the reference total power and the
absolute peak power levels and margins from limit lines which
correspond to the frequency bands on both sides of the reference
channel.
Figure 5-2 SEM - Total Power Ref, Abs Pwr Freq view
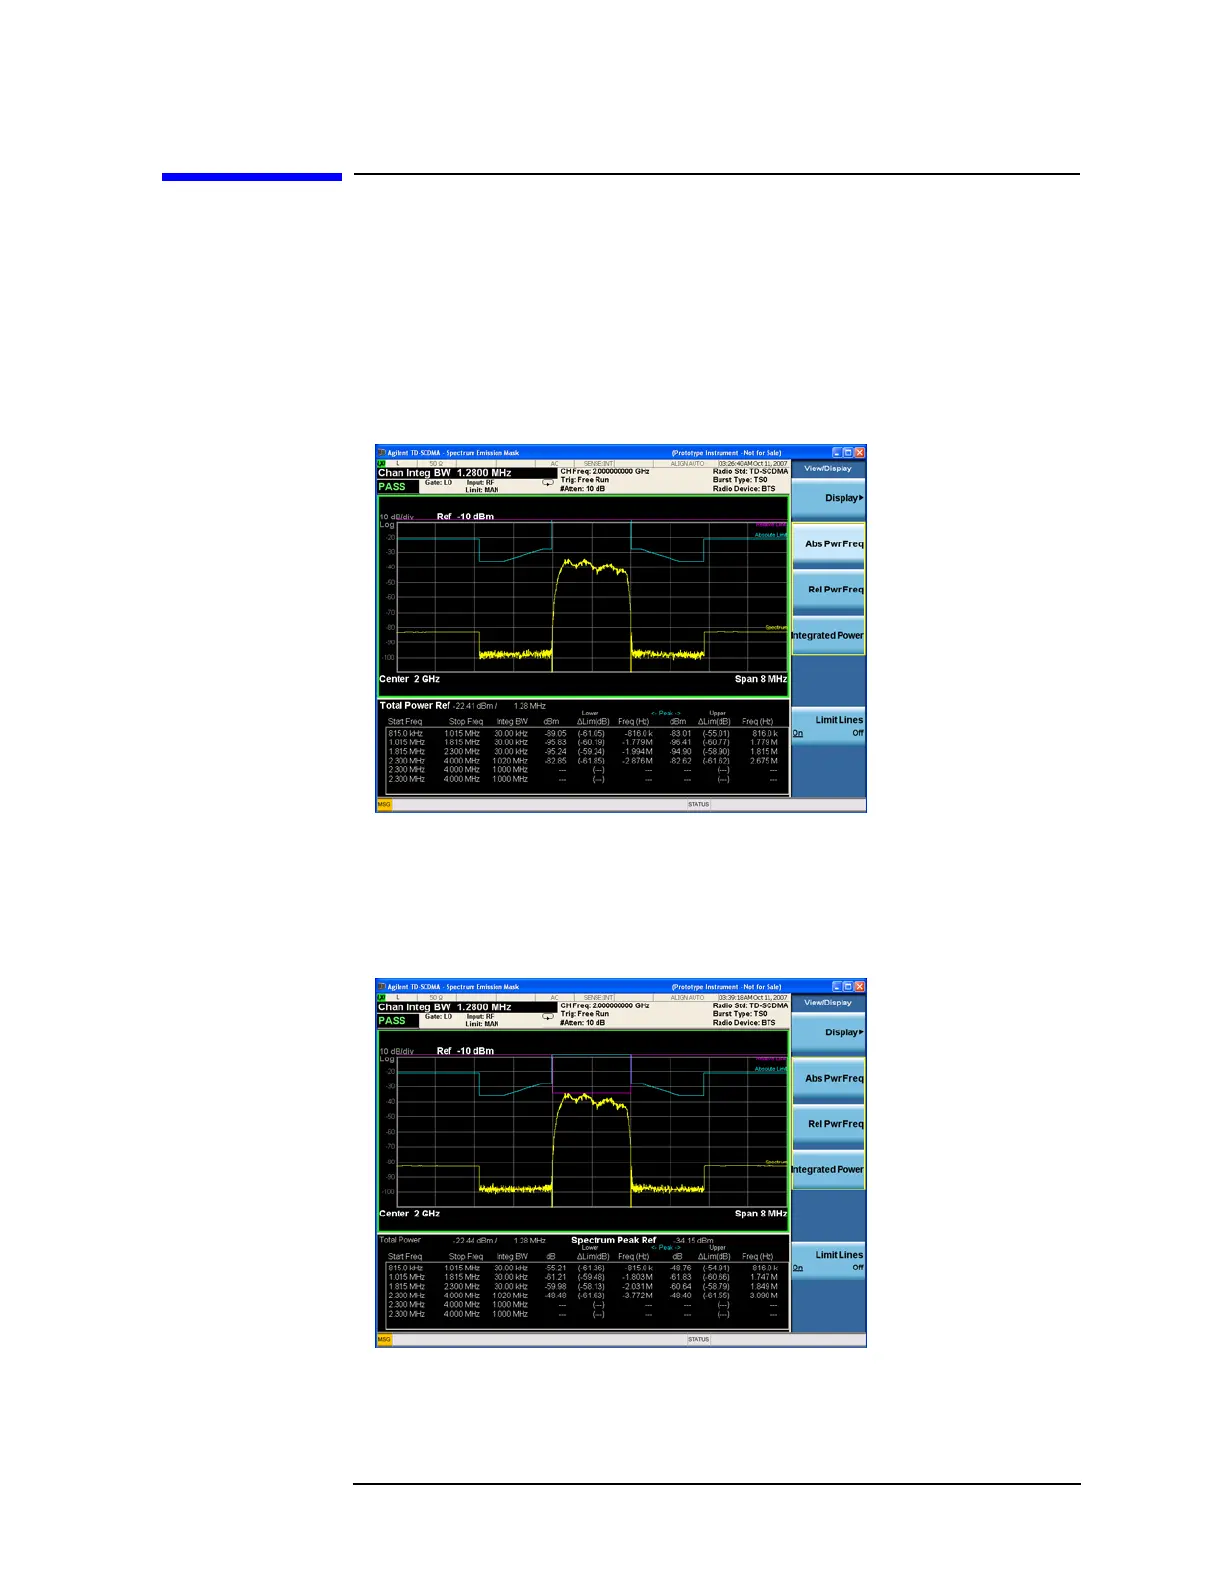
Figure 5-3 shows the Spectrum Peak reference and the relative peak
power levels and margins from limit lines which correspond to the
frequency bands on both sides of the reference channel
Figure 5-3 SEM - Spec Peak Ref, Rel Pwr Freq view