80 Chapter 10
Code Domain Measurements
Results
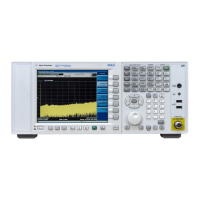
Figure 10-5 shows a combination view of the code domain power,
symbol power, and I/Q symbol polar vector graph windows, with a
summary results window.
The summary data at the lower right indicates peak and RMS EVM,
magnitude and phase errors, powers of the signal and the channel.
Figure 10-5 Code Domain Measurement Result - Code Domain Quad View
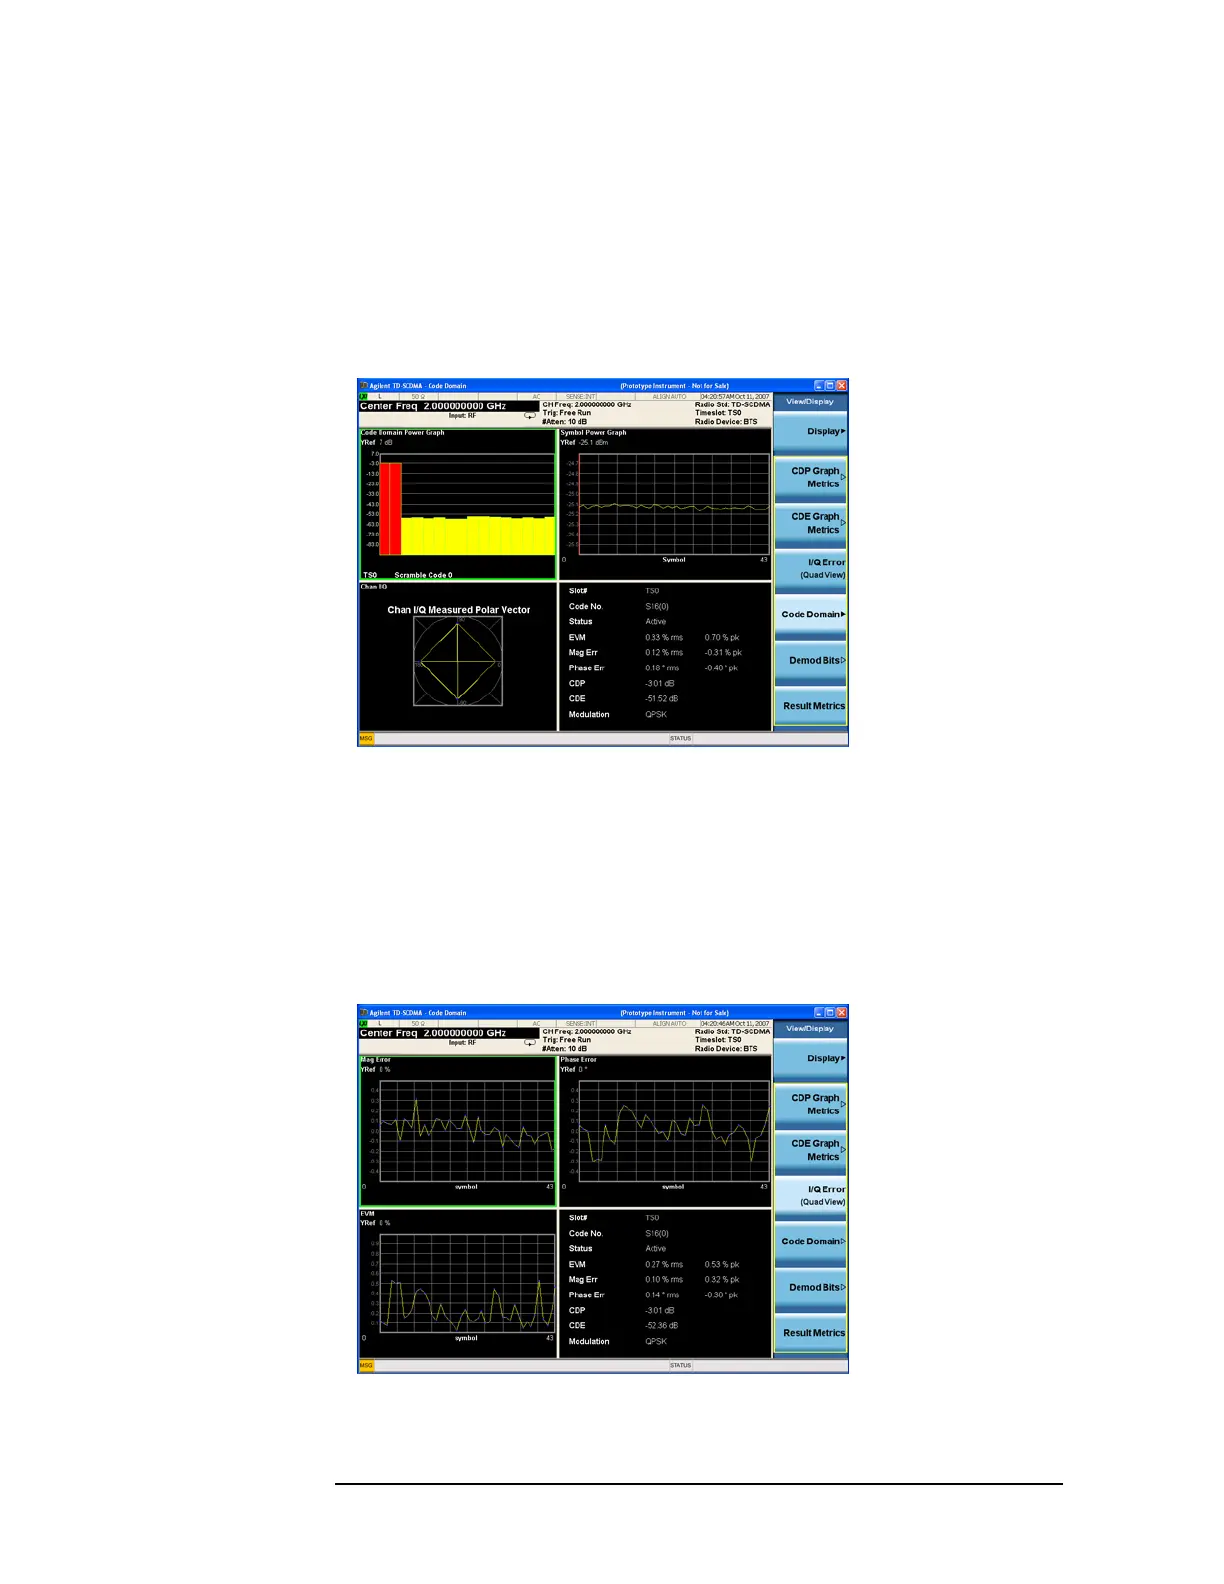
Figure 10-6 shows a combination view of the magnitude error vs.
symbol, phase error vs. symbol, and EVM vs. symbol graph windows,
with the modulation summary results window.
The results screen shows the data for the same code domain channel
that was selected for despreading by the marker in the Code Domain
Quad View.
Figure 10-6 Code Domain Measurement Result - I/Q Error Quad View
 Loading...

