Chapter 10 81
Code Domain Measurements
Results
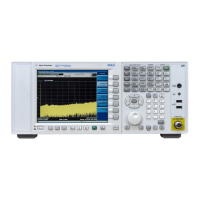
Figure 10-7 shows a combination view of the code domain power,
symbol power graph windows, and the I/Q demodulated bit stream data
for the symbol power slots selected by the measurement interval and
measurement offset parameters.
The Demod Bits View displays the same Code Domain Power and
Symbol Power windows as the Code Domain (Quad View) shown in
Figure 10-6.
The demodulated bit stream displayed is the data contained in the
Meas Interval 1. In the Symbol Power graph, this is the data shown as
the red vertical bars.
Figure 10-7 Code Domain Measurement Result - Demod Bits View
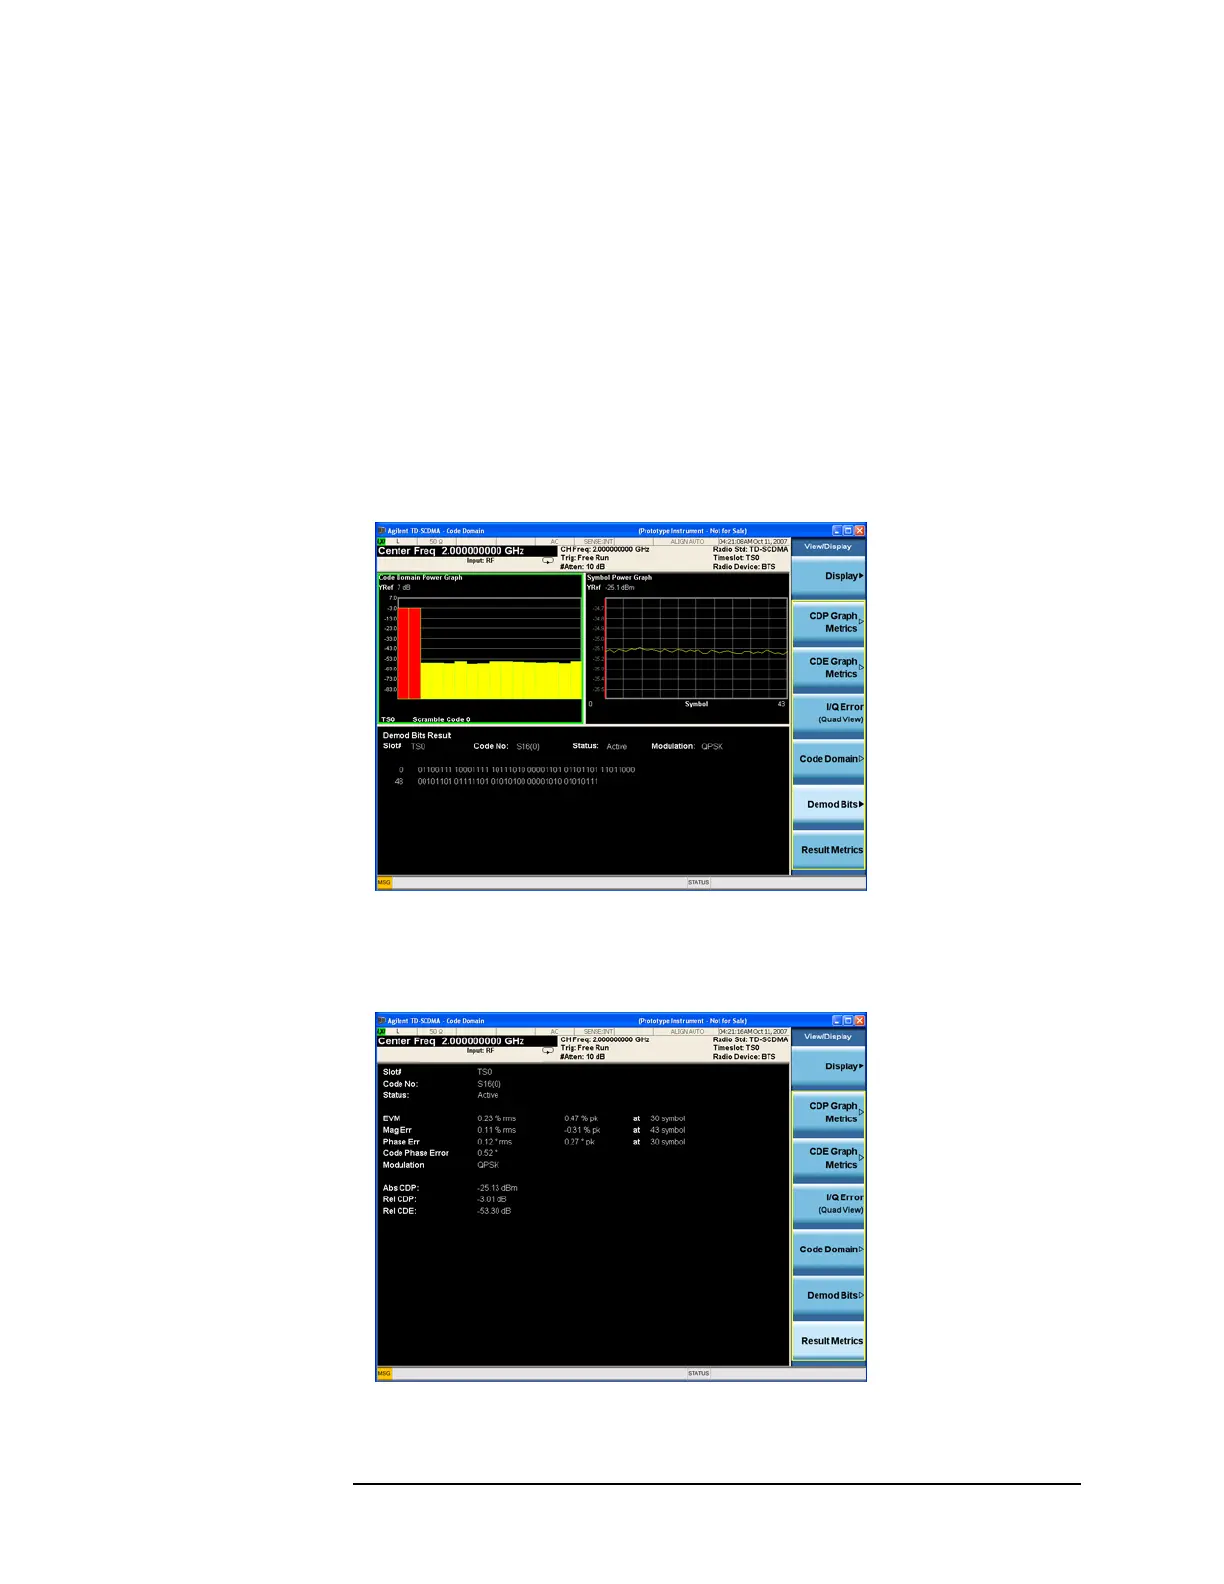
Figure 10-8 shows a result summary window.
Figure 10-8 Code Domain Measurement - Result Metrics View
 Loading...