BRIDGE LIVE Video I/O and Streaming Appliance v1.12 16 www.aja.com
Returning to Dashboard Home View
At any time, to return to the main Dashboard home view, click the AJA/
Comprimato logos in the top left area of the Dashboard interface.
The Left Column (Pipelines)
NOTE: A "Pipeline" is the overall setup, from input source to decode, encode or transcode
of output format(s).
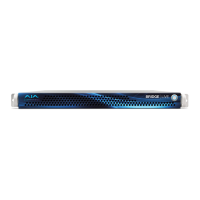
Beneath the AJA and Comprimato logos, in the top left of the interface, is a
summary of the number of running Pipelines, beneath which are flags for Errors
(Red) or Warnings (Yellow).
Flags, Warnings and Errors
The Pipeline status indicators shown in Figure 4 below show the number and
types of errors, along with indicators for configured and applied Pipelines.
Hover the mouse over a half circle to see specific error messages for a Pipeline.
Figure 4. Pipeline status indicators
Below the errors and warning flags are the pipelines.
On the left side, each pipeline has a circular status icon. The left half of the
colored circle provides feedback on the incoming part of the pipeline, while the
right side indicates the status of the outgoing part of the pipeline.
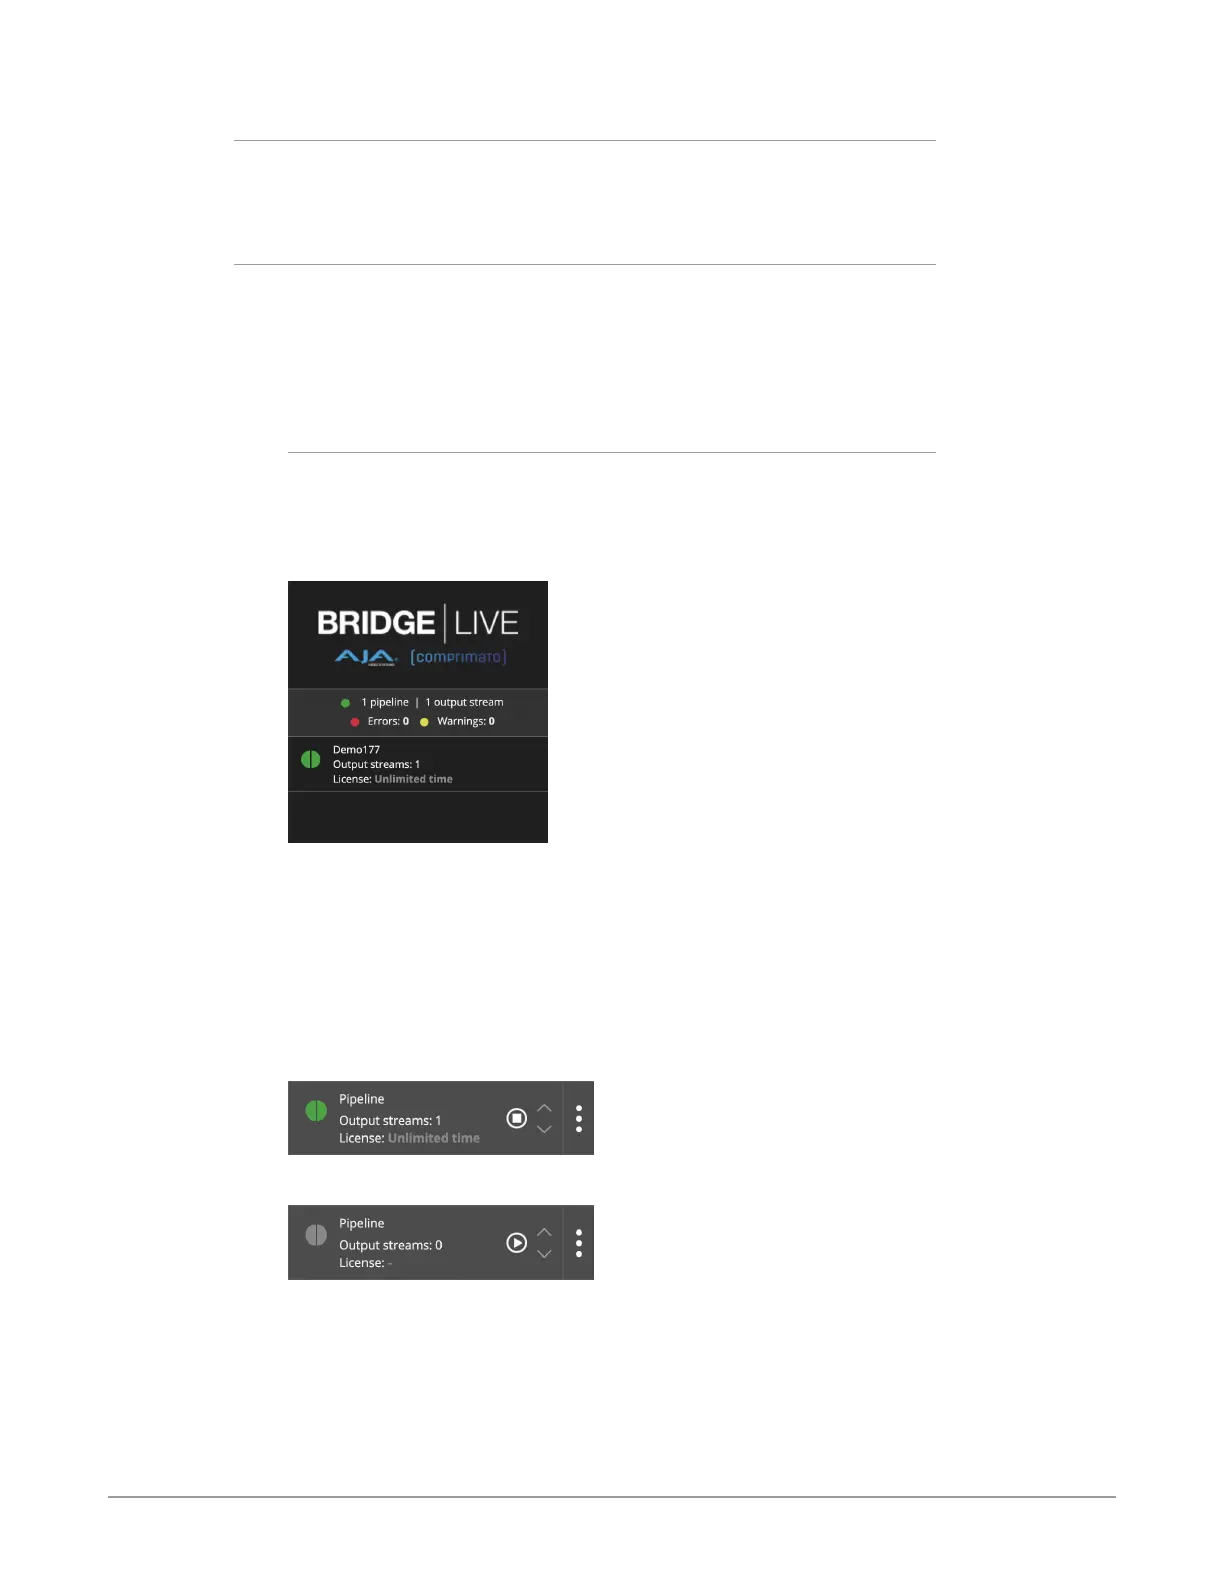
Immediately to the right of the circular icon is the name of the pipeline. Further
to the right, when hovering the mouse over the pipeline, there is also a toggle
pipeline stop and start button.
Figure 5. Pipeline Stop Button
Figure 6. Pipeline Play Button
When hovering the mouse, along the right edge of each pipeline is a vertical
row of three dots. Clicking on the three dots will toggle the button to display the
following three options:
• Delete
• Clone
• Download