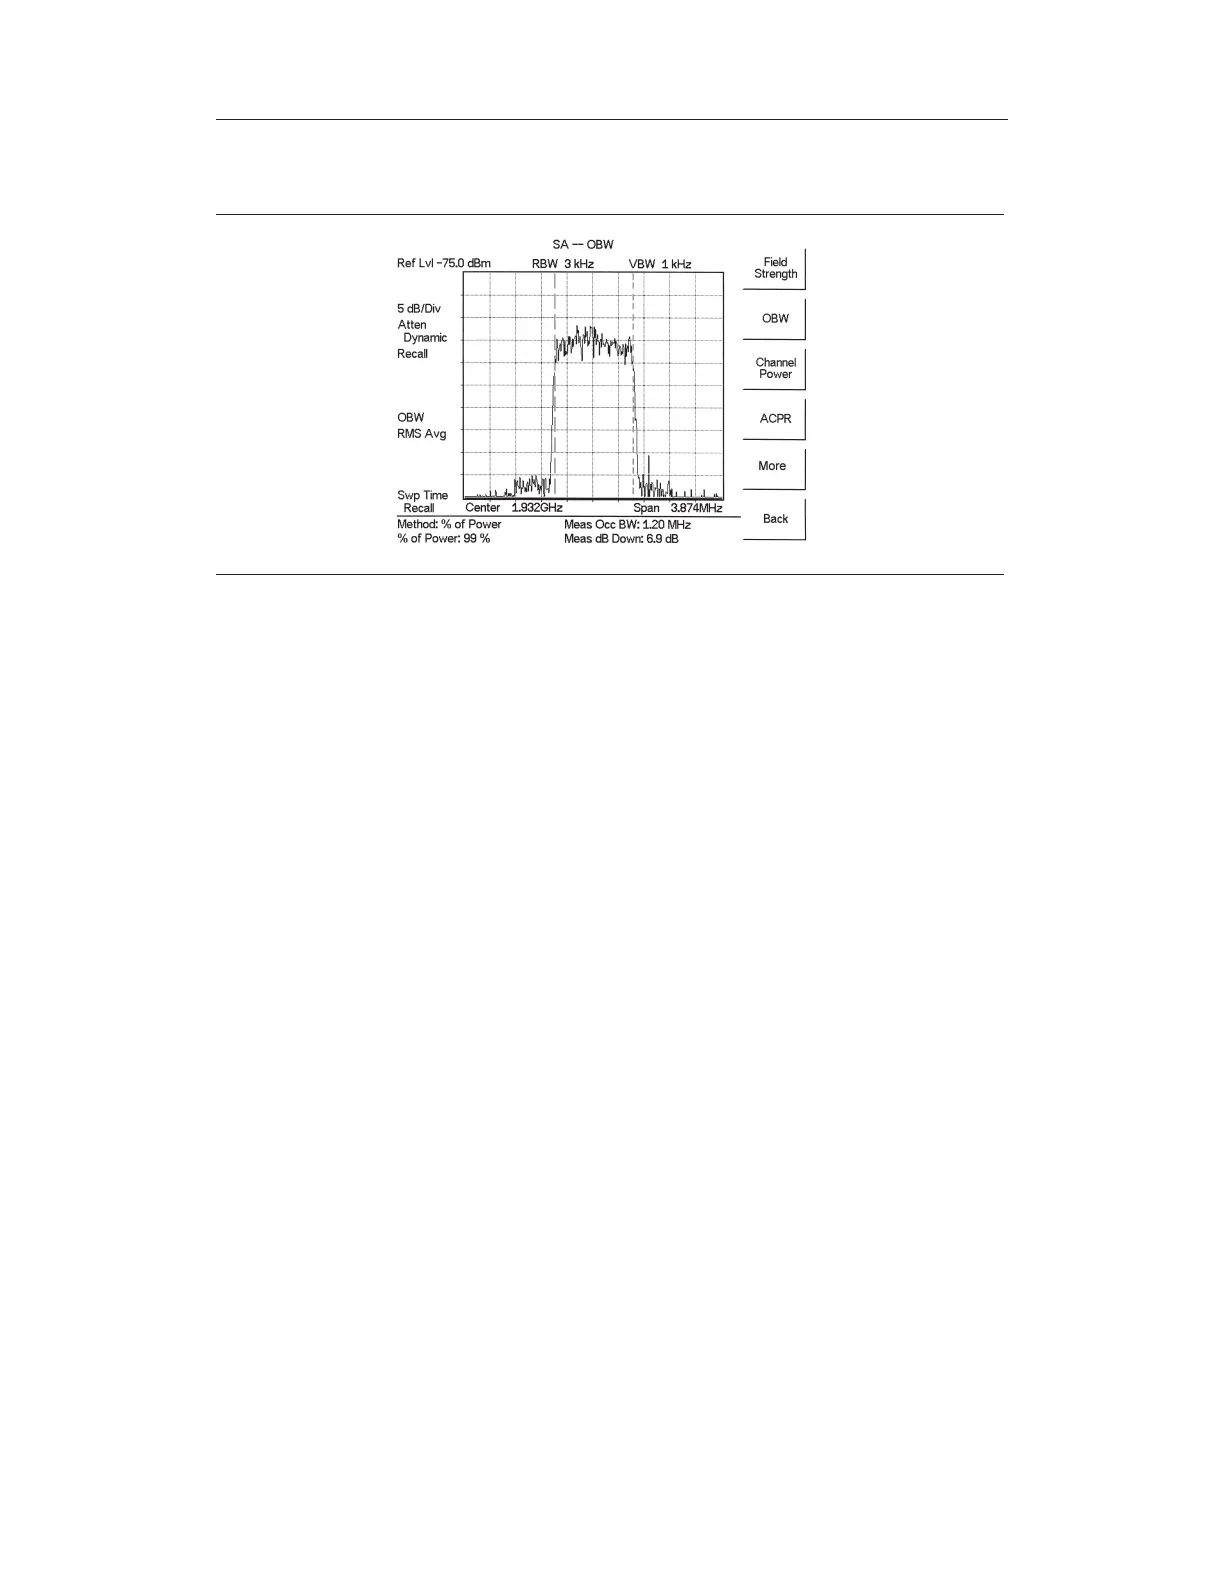
Figure 5-4 shows the occupied bandwidth results using the % of power method of a CDMA
signal.
Occupied bandwidth is calculated at the end of a sweep. An hourglass is displayed as the
calculations are performed.
Markers M1 and M2 indicate the occupied band on the graph. The measurement results ap-
pear beneath the graph.
5-11
Chapter 5 Spectrum Analyzer Measurements
Figure 5-4. Occupied Bandwidth