Chapter 6: Using OrionNET Software
Argus TubeSpec User Guide NOV CTES 63
Using TubeSpec Views
Double-click the OrionNET Viewer icon on the desktop to access the Viewer application.
Three OrionNET views are installed with the Argus TubeSpec software version: chart, probe data, and
waveform. Each view is comprised of a primary control and other, additional OrionNET controls. See
“Working with Controls in the View Designer or Viewer” in the OrionNET Software User Guide for
additional information regarding the use of controls in OrionNET views.
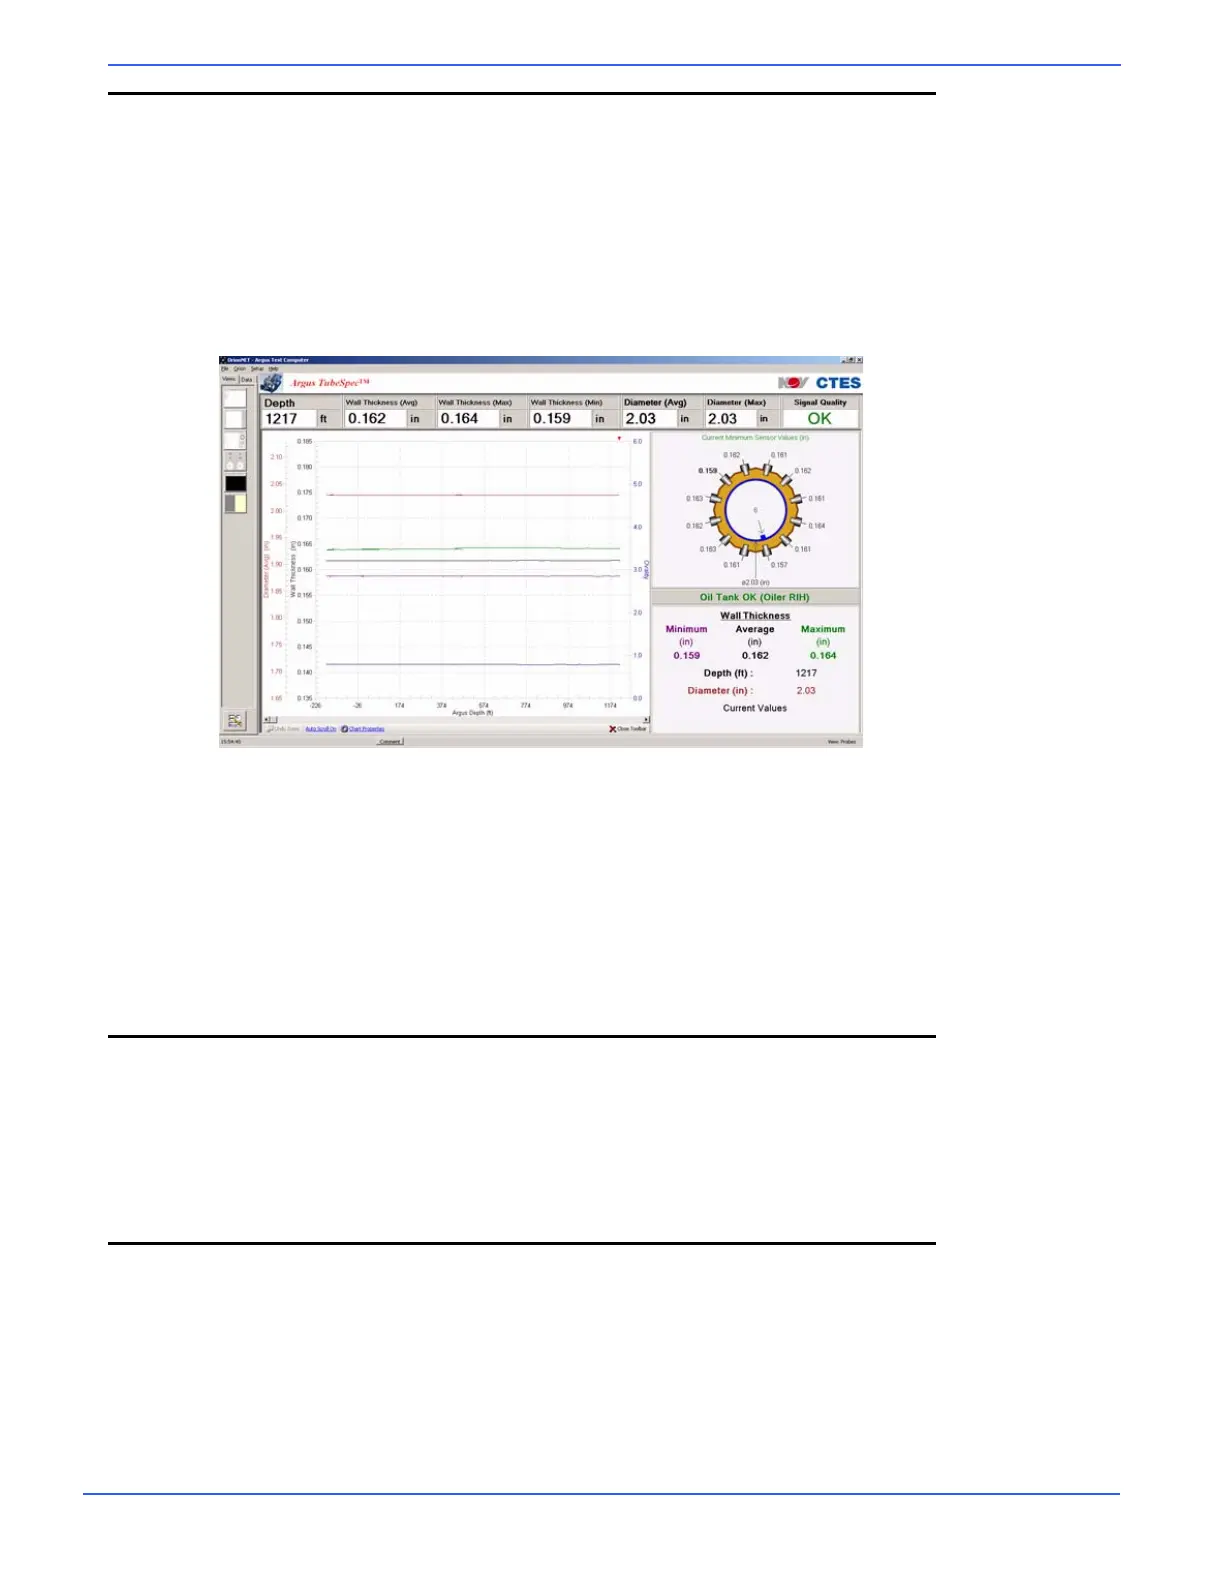
The TubeSpec chart view (the default) appears similarly to the screenshot below:
To access initially available views other than the default view
1. Click the Views tab (default) within the left-hand menu of the Viewer.
2. Select a view to make it available in the main Viewer screen.
OR
Right-click the view to open it in a new window.
Using the View Designer
The OrionNET View Designer allows the creation and/or modification of an existing view. As stated in
the OrionNET Software User Guide, the user may alter an existing, in-use view (a view that is visible
in the main portion of the Viewer) directly, or via the View Designer. Generally, the user creates a new
view using the View Designer.
Using the TubeSpec Chart Control
The Argus TubeSpec chart control appears by default in the chart view. It is provided as a means of
graphically viewing the coiled tubing average diameter; ovality; current minimum sensor values; and
minimum, maximum, and average wall-thickness values as measured and recorded by the TubeSpec
system.