Chapter 6: Using OrionNET Software
76 NOV CTES Argus TubeSpec User Guide
To display the waveform of a specific probe/UT sensor number
1. Select the Probe number from the combo box using the up/down arrows to locate the correct probe/UT
sensor.
2. Click the Start Waveform button.
A waveform appears in the display screen.
Only one waveform is viewable at any one time.
To display a different waveform
1. Click the Stop Waveform button.
2. Repeat the steps in To display the waveform of a specific probe/UT sensor number
.
Using OrionNET Reporting
The TubeSpec OrionNET Reporting functionality provides a supplementary tab to the tabs found in the
base OrionNET Reporting functionality – Argus TubeSpec™. Available within the OrionNET Reporting
display screen (see “Using the OrionNET Reporting Tabs” in the OrionNET Software User Guide for addi-
tional information), the tab provides TubeSpec-specific display and printing options.
The setup of the properties pertaining to the Reporting chart-plotting area is identical to the setup of the
Viewer-chart properties. See Setting the Chart Plotting-area Properties
for complete information.
As mentioned in Setting the Chart Plotting-area Properties
, the chart supports plotting by either time
(default) or depth (if an OrionNET CT Depth channel is available – see Updating the Default Configura-
tion to include a CT Depth channel). Plotting by depth is an excellent way to observe measurements over
the entire length of the tubing.
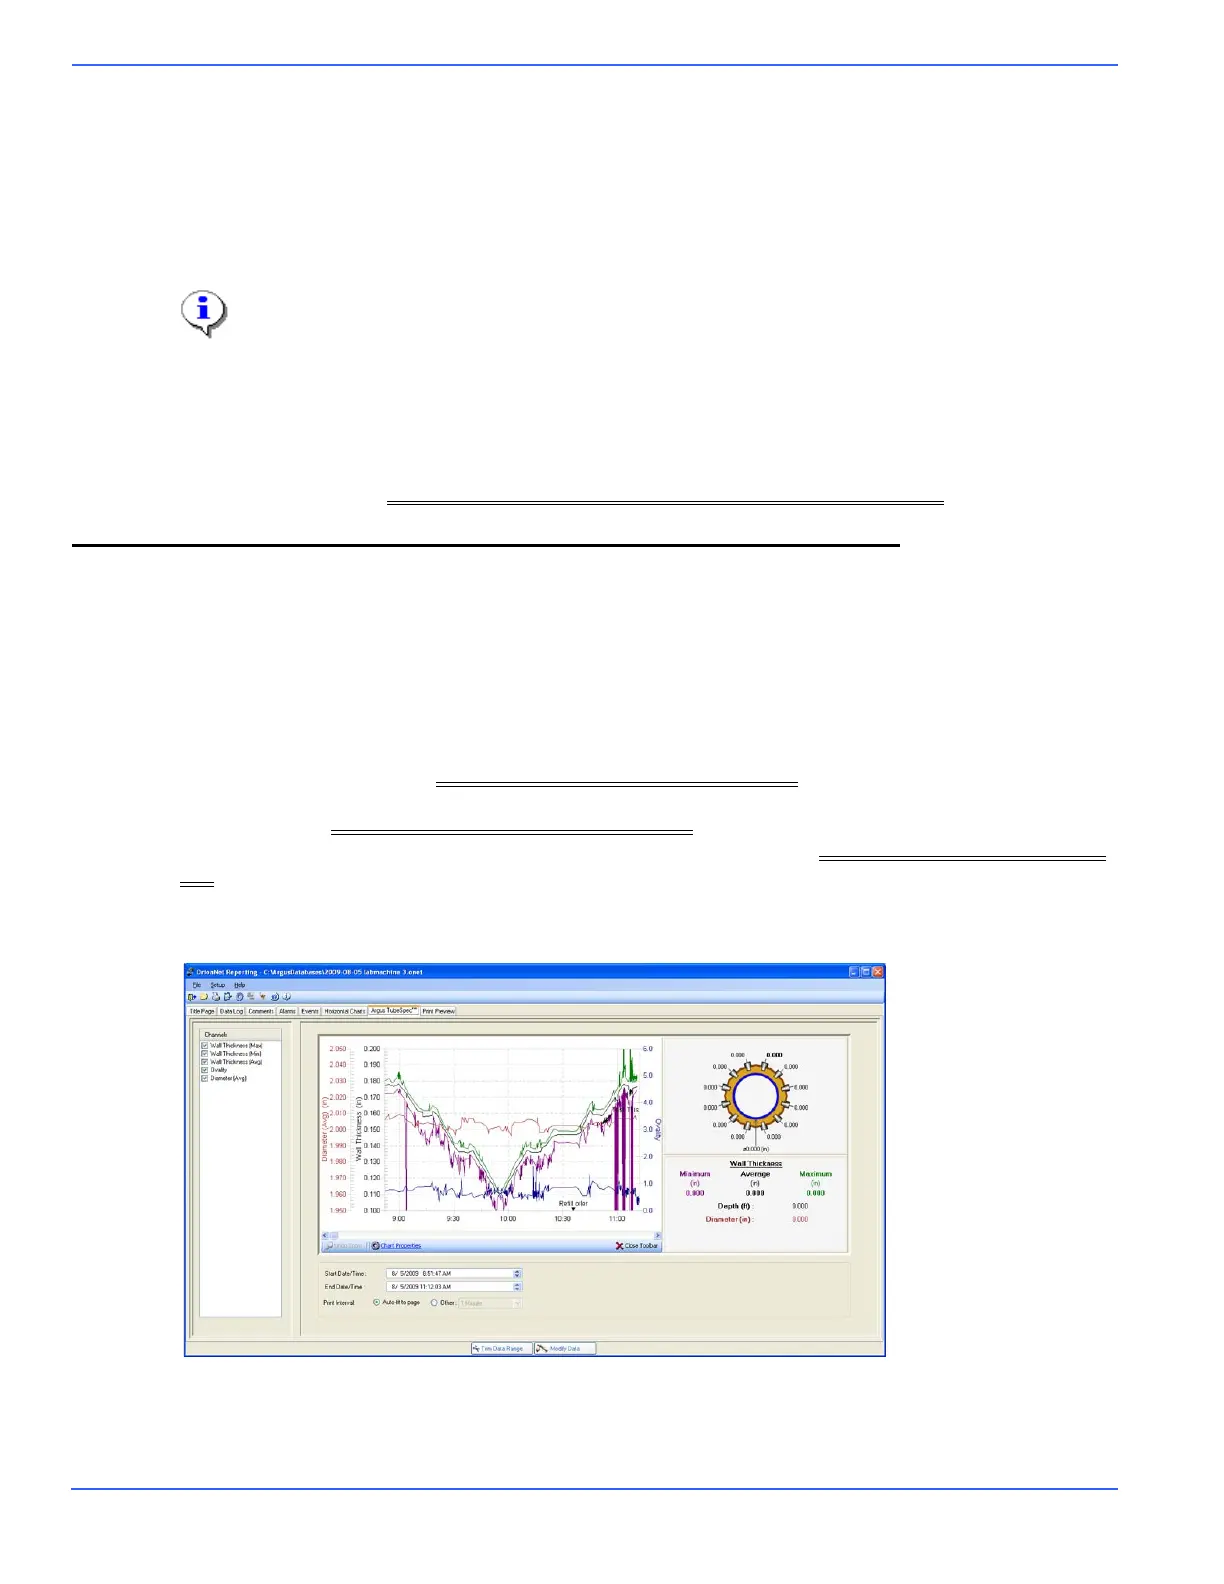
Below is an example of a Reporting chart in “time mode.”