Chapter 6: Using OrionNET Software
64 NOV CTES Argus TubeSpec User Guide
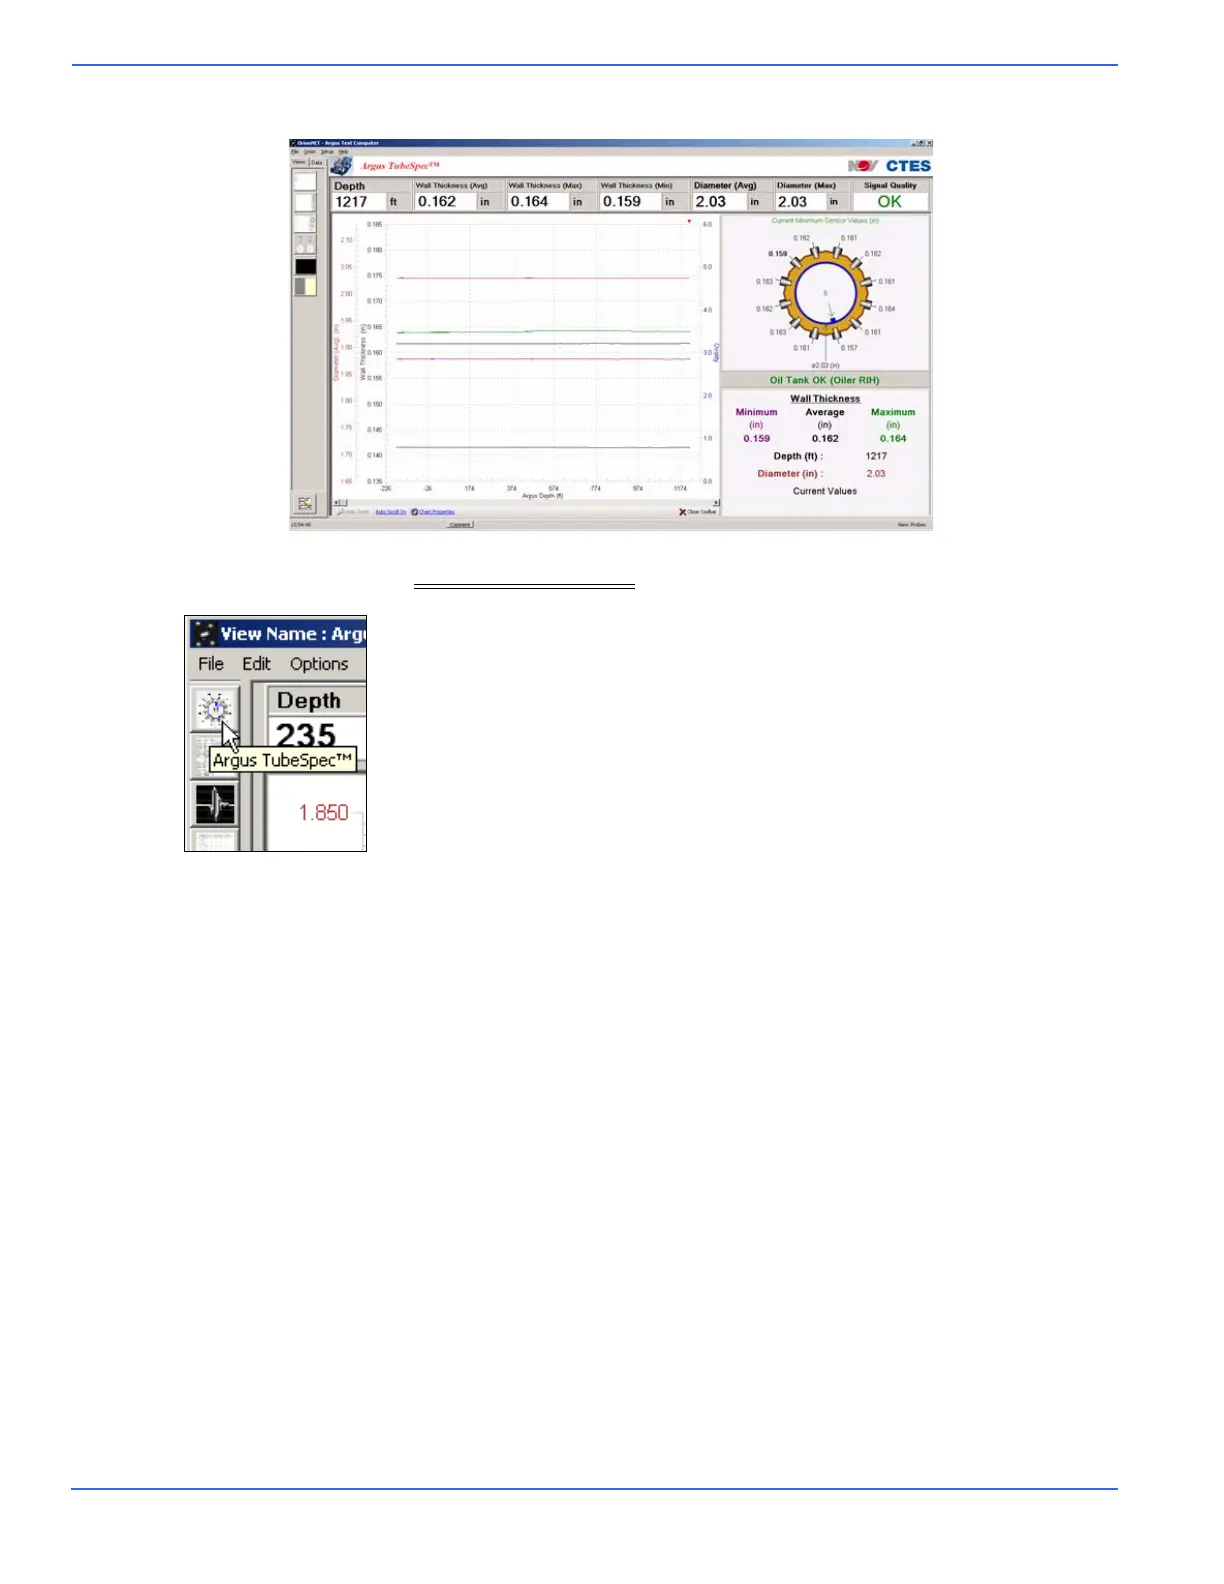
The TubeSpec chart control appears in an OrionNET view similarly to the
following:
In the View Designer (see Using the View Designer
), the user clicks on the Argus TubeSpec™ toolbox
icon to add a chart control to a view.
The chart control is divided into three functional areas: chart plotting, sensor-array display, and chart leg-
end.
Working with the Chart-plotting Area
Setting the Chart Plotting-area Properties
The chart plotting area is pre-configured to plot five recorded TubeSpec measurements: average diameter;
ovality; and minimum, maximum, and average wall-thickness. The scale provided on the right-hand side
of the chart provides ovality readings. On the left-hand side of the chart appears a scale describing average
diameter. An additional left-hand-side chart scale describes all three wall-thickness measurements.